Deploying Predictive Maintenance Algorithms to the Cloud and Edge
By Aditya Baru, MathWorks
For organizations that manufacture or operate industrial machinery, a predictive maintenance program is key to increasing operational efficiency and reducing maintenance costs.
At the same time, however, developing and deploying predictive maintenance algorithms to any asset, whether an aircraft, an MRI machine, a wind turbine, or an assembly line, can be challenging. Algorithm development requires not only extensive experience in machine learning techniques but also deep understanding of the system’s behavior. Engineers possessing both these skills can be hard to come by. Deployment, meanwhile, involves a complex series of steps and interconnections. The algorithm must be implemented on multiple assets. Those assets will be connected to multiple edge devices which, in turn, connect to an IT/OT system that may be cloud based, on premise, or both. Portions of a single algorithm may live on different elements of this infrastructure, adding to the complexity (Figure 1).

Figure 1. Components of a deployed predictive maintenance system.
Using a packaging machine as an example, this article shows how to handle these complexities by developing a predictive maintenance algorithm and deploying it in a production system with MATLAB®.
Packaging Machine Maintenance System
The packaging machine has several robotic arms (Figure 2, left). The arms move back and forth at high speed, moving objects onto the assembly line for packaging. They are connected to programmable logic controllers (PLCs) that communicate with a Microsoft® Azure®-based IT/OT system. This IT/OT system collects streaming data from the edge devices connected to the robotics arms, runs predictive maintenance algorithms based on this data to detect anomalies and predict when the arms might fail, and returns the results to dashboard tools used by engineers and operators.
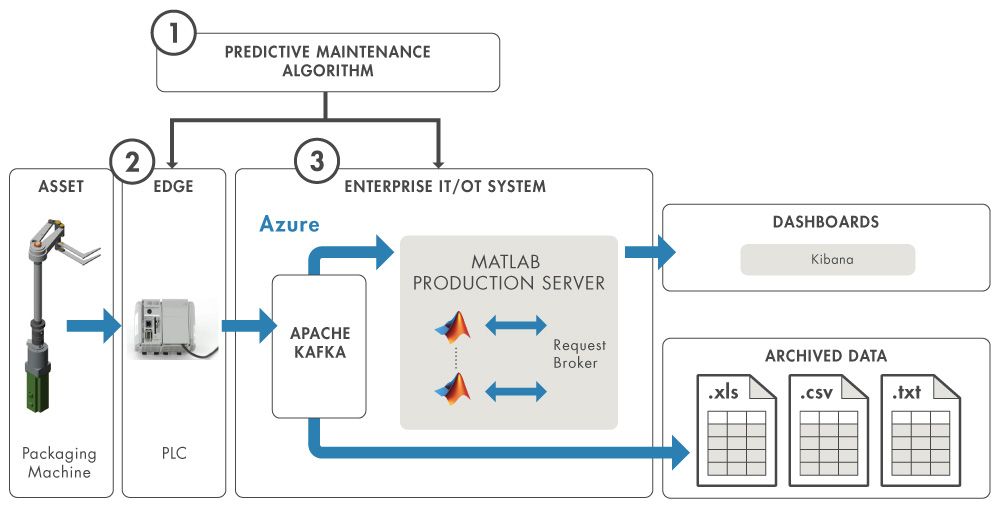
Figure 2. Packaging machine predictive maintenance system.
The Predictive Maintenance Algorithm
The predictive maintenance algorithm for this system has two components. The first is implemented on the edge and performs data reduction using feature extraction techniques. The second is implemented in the cloud and uses these feature values and a machine learning model to predict when a failure will occur and to estimate the machine’s remaining useful life (RUL). The results of this predictive algorithm are streamed into our dashboard in near real time.
Developing the Data Reduction Algorithm
The first part of our predictive maintenance algorithm acts on the raw sensor data generated by the robotic arms. We are tracking the speed and the current drawn by the motor driving each arm.
The sensors used for machines like these can sample data at a very high rate. Storing such vast amounts of sensor data can be expensive, and analyzing this data is time-consuming, as the sheer volume makes it hard to identify regions of interest. We can solve this problem with feature extraction.
Feature extraction techniques accept streams of raw sensor data and return a smaller set of features that capture key dynamics, significantly reducing storage and transmission needs. The sensors in the robotic arm capture data at 1 KHz—that is, at 1000 samples per second. Condensing one second’s worth of this data to a set of five features will reduce our data storage and transmission needs by a factor of 200.
Using the Diagnostic Feature Designer app in Predictive Maintenance Toolbox™, we import the sensor data, extract features using signal-based and dynamic-modeling techniques, and rank the features by their ability to distinguish data generated by a healthy machine from that generated by a faulty machine (Figure 3).
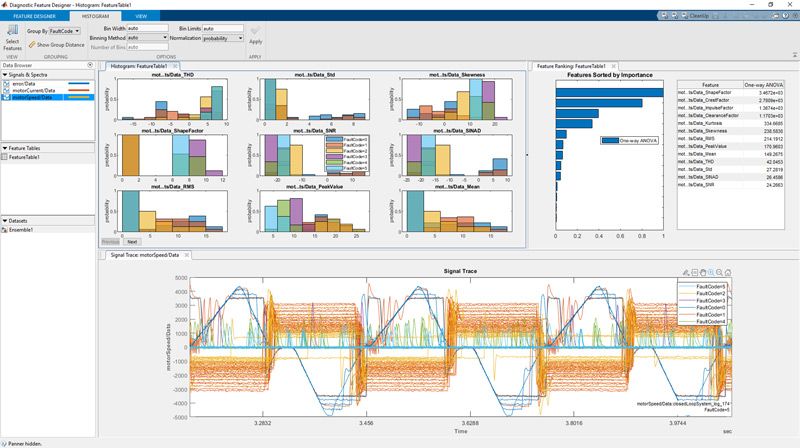
Figure 3. The Diagnostic Feature Designer app.
Once we have selected the features we want to extract, we are ready to implement and test the data reduction algorithm on the PLC that acts as our edge device. Instead of testing the algorithm on a real machine, which could damage the machine, we connect the PLC to a Simscape™ model of the robotic arm running on a Speedgoat real-time computer. This real-time computer can communicate with our PLC by sending and receiving data as if it were an actual machine. We begin by generating C code for the data reduction algorithm with Simulink Coder™ and deploying it to the PLC. We then deploy our packaging machine model to the Speedgoat system and perform simulations under different fault conditions to ensure that our algorithm will work correctly in a real-world environment (Figure 4).
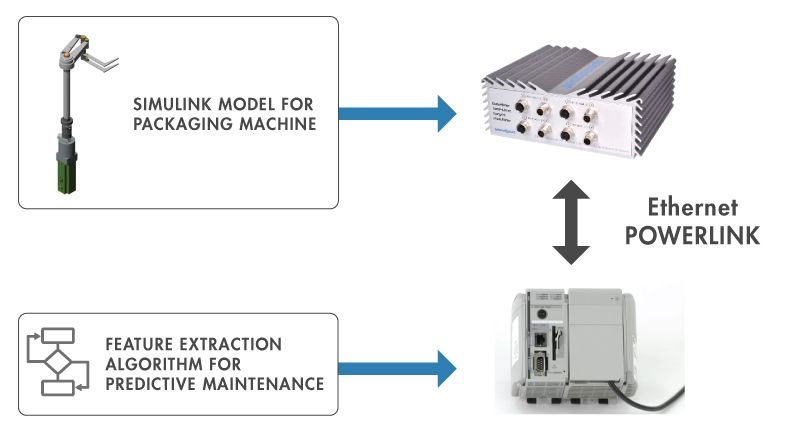
Figure 4. Deployment to PLC and testing in real time using Speedgoat hardware.
Developing the Predictive Algorithm
We now have an edge device that reduces the amount of data being transmitted by extracting meaningful features from it. We can stream the reduced dataset into our IT/OT system using Apache™ Kafka, an open-source stream processing platform running in the Azure cloud. We will use this streaming data to estimate the RUL of the packaging machine motors.
As the condition of the motor deteriorates over time, the values of the extracted features will increase or decrease steadily, at a linear or exponential rate (Figure 5). Based on this trend, we select an exponential degradation model in Predictive Maintenance Toolbox to predict the future health of the machine.

Figure 5. Sample RUL plot of streaming data.
To make this algorithm compatible with a cloud-based system, we use MATLAB Compiler SDK™ to create an executable, which we then integrate into the IT/OT system using MATLAB Production Server™ (Figure 6).

Figure 6. Cloud deployment overview.
We now have machine learning algorithms that predict failures in our packaging machine using features extracted from raw data by edge devices connected to individual robotic arms, and a web-based dashboard that gives us immediate access to the results (Figure 7).
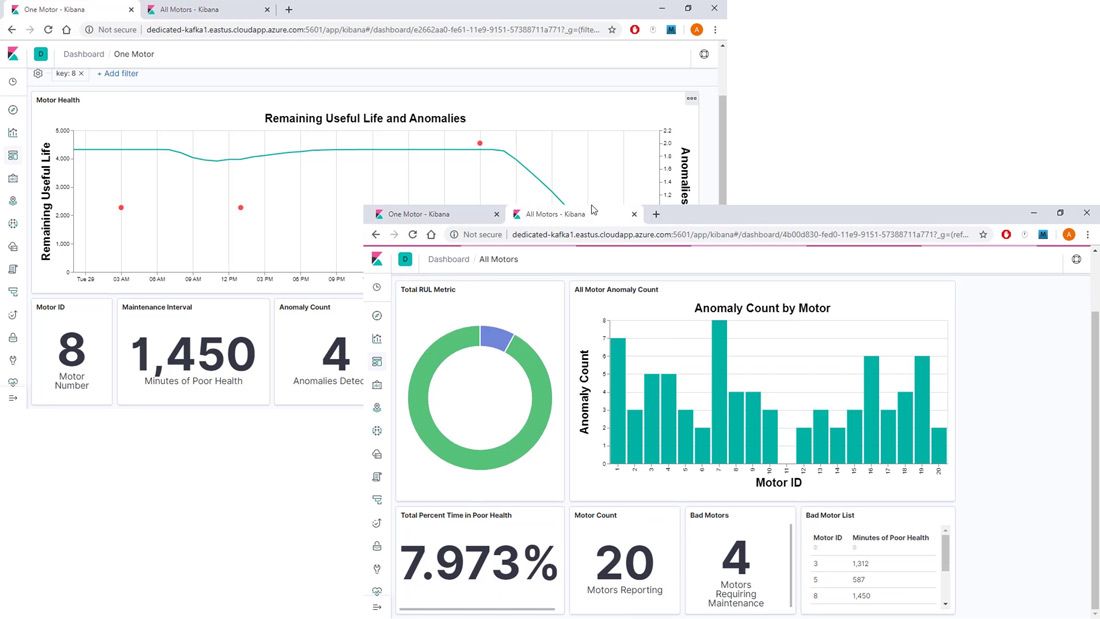
Figure 7. Final web dashboard.
Case Study: IMA Active
IMA Active designs and manufactures automatic processing and packaging machinery for the pharmaceuticals industry. The company wanted to develop a predictive maintenance system that would monitor the health of a tablet press production machine. The machine has critical moving parts that require precise lubrication. Too little lubricant causes stress and failure. Too much lubricant can cause leakage into the final product.
The predictive maintenance system would use data obtained from the two sensors already available on the machine and would be self-teaching, with no need for external intervention.
IMA Active engineers used Predictive Maintenance Toolbox to develop algorithms for the system. They began by extracting features from the two sensors—a total of 36.
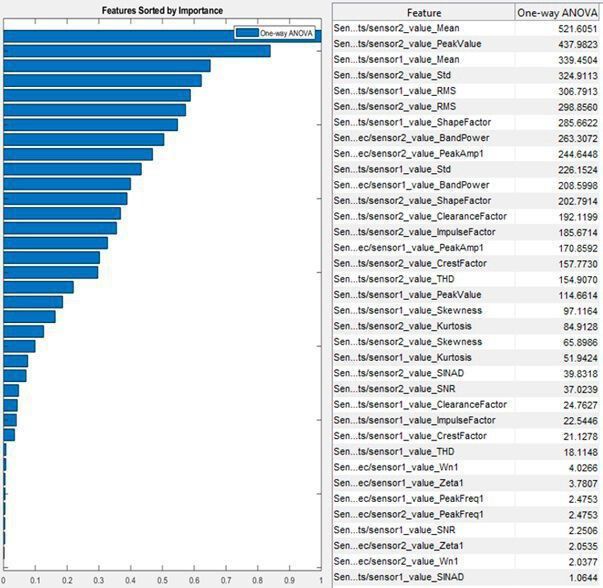
“Using MATLAB tools, we managed to extract and select the best features to build a classification model. The most promising algorithm uses five features and has an accuracy of 89%.”
They extracted, visualized, and ranked features from the sensor data using the Diagnostic Feature Designer app in Predictive Maintenance Toolbox. With these features they trained a fault classification model that uses machine learning techniques to estimate the health of critical moving parts in the tablet press.
The predictive maintenance system enables machine operators to optimize resource use and schedule maintenance activities according to production needs.
Published 2020