Visualizing Simulation Data with Simulink
By Michael Carone, MathWorks
You know that your Simulink® model has no structural problems because the simulation runs to completion. But how do you know that the system is behaving as it should? To answer this question you need to know what the simulation output looks like throughout the simulation and how changes in system parameters or environmental characteristics affect the system’s response.
With Simulink you have many options for obtaining this information. This article guides you through these options, from tools intended for the early phases of development, when you are still debugging the model, to tools more often used for deeper simulation data analysis.
Port Value Displays – Probe a Signal When Debugging a Model
When debugging a model to isolate a particular issue, you often need to probe a signal or set of signals. To do this in Simulink, you right-click a signal and select “Show Value Label of Selected Port". You can then monitor the value of a particular signal or the value of each element of a bus signal at each time step of the simulation (Figure 1).

To turn off the visualization you simply right-click the signal again and deselect that option.
Scopes and Other Display Blocks – View Simulation Data Quickly
The Port Value Display gives you the value of a signal at each simulation time step. To see how the values of signals change over time, you add a Scope block (Figure 2). Connect a signal line to a Scope block, run the simulation, and view the data both during and after the simulation.

You can add interactive cursors to a Scope block to measure various points on the signal or axes. Signal statistics such as maximum, minimum, and median values can be displayed for a given signal. You can add oscilloscope-like triggers so that the Scope displays a signal or pauses the display when certain events occur.
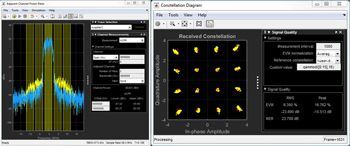
Within the signal processing and communications area, there are several other types of visualization tools that you can add to a model to view simulation data quickly. For example, you can use the Spectrum Analyzer block to view data in the frequency domain (Figure 3, left), or use the Constellation Diagram block to view the constellation of a digitally modulated signal (Figure 3, right).
Dashboard Block Library – Tune and Monitor Simulations in One Place
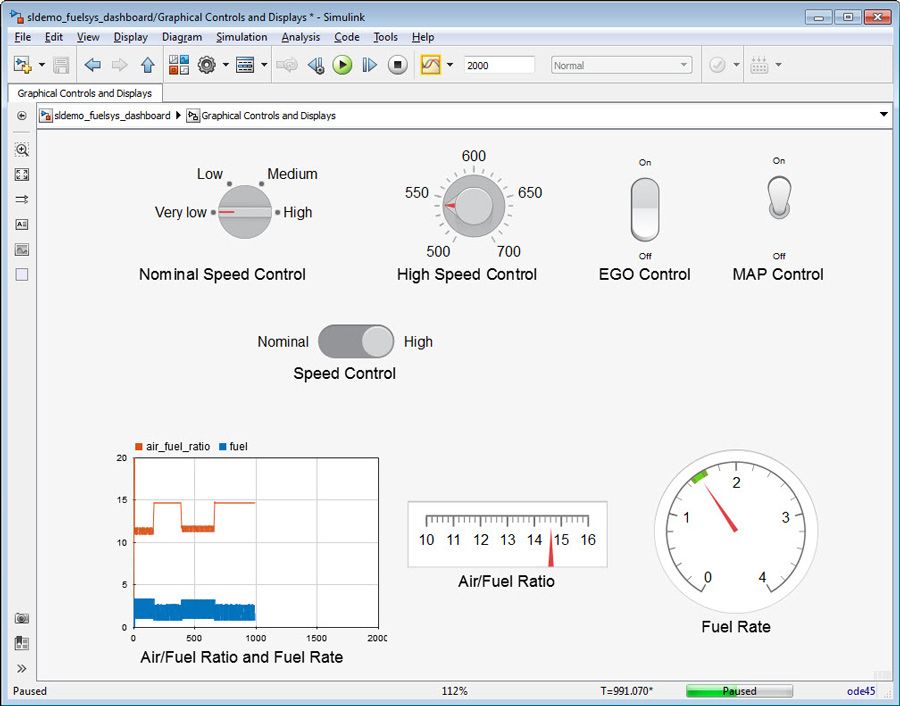
As your design progresses, you will probably want to set up an interface at the top level of the model so that you and your colleagues can control and monitor the simulation in one place. You can do this using graphical controls and displays from the Dashboard block library (Figure 4).
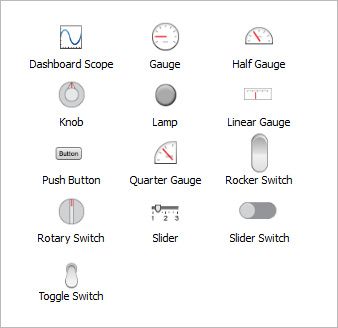
This library contains different types of displays, such as gauges and lamps. You can associate these displays with specific signals in the model by opening the display block and selecting the signal or block that you want to connect to that block. When the simulation runs, the displays update continuously inside the model window, enabling you to view all important simulation data at once (Figure 5).
Simulation Data Inspector – View and Analyze Data from Multiple Simulations
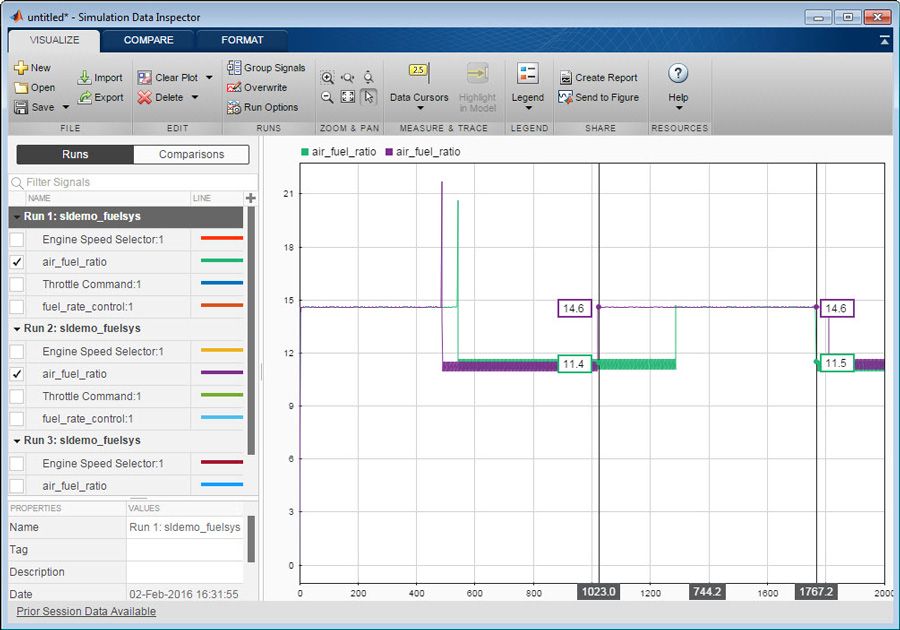
As you develop your model, it is often important to run multiple simulations to test different scenarios or to optimize design parameters. By this point you could be monitoring hundreds or even thousands of separate signals. The Simulation Data Inspector can be used to store all this data from multiple simulations in one place (Figure 6).
You can then compare all the data from these simulations to check, for example, that the difference in the signal output from one simulation to the next is within a certain design tolerance.
MATLAB Graphics – Customize Your Data Analysis and Visualization
Many Simulink visualization tools focus primarily on the time and frequency domains. To view your data in other domains or in a way that is not available in Simulink, you can use MATLAB®. All data produced from Simulink can be accessed within MATLAB for further custom data analysis, either from the command line or through scripts. This data can then be viewed in MATLAB figures and charts (Figure 7).

Specialized Visualization Tools
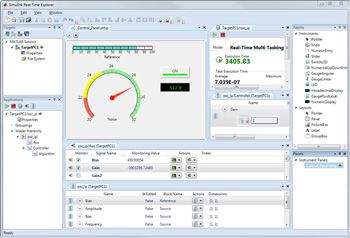
So far, we have reviewed visualization tools for general applications. Tools are available for specific applications, as well. For example, when running real-time simulations on a target machine using Simulink Real-Time™, you can tune parameters and view the real-time simulation data on your host machine (Figure 8).
When tuning control systems, you can plot information such as the poles and zeros of the controller or the Bode response of the model with Simulink Control Design™ (Figure 9).

In addition, to get a better understanding of how your system behaves within its expected environment, you can connect full 3D environments to your Simulink model using SimMechanics™, Aerospace Blockset™ with FlightGear, and Simulink 3D Animation™ (Figure 10).

Summary
Now that you have seen the wide array of visualization tools available throughout the design cycle, be sure to simulate your models often so that you find and remove design flaws as early as possible. Frequent simulations mean that your final implemented system will be better prepared for rigorous verification, validation, and testing.
Published 2015 - 92923v00
