Importing Data and Noncompartmental Analysis | SimBiology Tutorials for QSP, PBPK, and PK/PD Modeling and Analysis
From the series: SimBiology Tutorials for QSP, PBPK, and PK/PD Modeling and Analysis
Importing Data and Noncompartmental Analysis video: This video demonstrates how to import data into SimBiology from spreadsheets, how to calculate derived data from the columns in the dataset and visualize the data. The dataset is also used to perform noncompartmental analysis, and the results of this analysis are then exported to a spreadsheet.
Published: 13 Sep 2020
In this video, we will be showing how to import experimental data into SimBiology and how to perform non-compartmental analysis on that data.
First thing we need to do is import data, and SimBiology allows you to import data directly from file, such as spreadsheets that are comma separated or Excel sheets. In this case, we will be using theophylline, and we're going to import that as a CSV file. In that case, the column separator is a comma. And, once you fill in that it is a comma, you can see that SimBiology automatically populates the columns and also populates the column headers from the first row.
If we click OK, the data is imported into SimBiology. You can rename the data. Here you can see the data. We have, in this case, 12 groups. And, for each group, we have a time column, and a concentration column, and a dose column, as well as a weight column. So the weight is here, a covariant.
In this case, the data is normalized by body weight. And, you can undo that normalization by adding a column to your data set. I first need to fill in the actual expression to calculate the concentration, in the column named DV, and then dot times WT. And, dot times means that the DV value for each element is element bias multiplied by the weight.
So, we can give this a name. We can call it concentration. And, we can add another column for the dose, because the dose is also normalized. So, here we can do the same. We can say dose, dot times weight, and call this dose total.
Below the column name, you can actually see a row that says classification. And so, we can classify each of these columns as to what they represent in the data. The concentration is a dependent variable. The dose is a dose column. And then, we can set the weight to be a covariant.
You can also add units for the concentration, for example, in milligram per liter, the dose in milligram, and the covariant in kilograms. The time is an hours. And, that completes the entire setup of our data set.
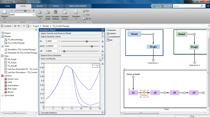
We can also have a look at the data itself. In that case, you can create a new plot and simply drag the data out onto the plot. And then, you can see that this is an oral dosing, followed by the clearance. We can plot that in a semilog y to have a bit of a better idea. And then, you can see this probably looks like a one compartment model.
So, we now have the data all set up. If we want to do non-compartment analysis, the only thing we need to do is add a program called non-compartmental analysis.
This program takes in a data set. In this case, there's only one data set in your in the project, but there may be more in your case. And then, you need to say which columns in your data sets you want to use for which classification in the model. Now, because you already did the classification in the data set earlier, this is automatically done. The only thing you will need to change, in this case, is the dosing is not IV Bolus, but instead, it is extravascular, so you need to move the dose column to extravascular.
The other thing we can do, is we can set time ranges. So, for example, if I want to calculate partial, I use c between zero and 12. I can do that like this. And, I can also define a lower limit of quantization.
So, with all of this setup I can run the program. And then, you can see the results here. There under program one, last run. And, the only thing I need to do is I generate a new data sheet and pull the results onto here. And here, for every error of the 12 subjects, you see the results from the non-compartmental analysis. So, you see an AUC, C-max, and then all the way at the end, you also get your partial AUCs.
If you want to, you can export this to a workspace, or the other thing you can do, is this data sheet number two, you can export that to Excel.
And, that completes this video on importing data into SimBiology and performing non-compartmental analysis.


