NR SS/PBCH Block Detection Performance
R2026bThis example shows how to measure the detection performance of the 5G NR synchronization signal (SS) and physical broadcast channel (PBCH) block, also referred to as the SSB, under configurable impairments.
Introduction
During initial cell search, the UE must first synchronize with the network. The UE identifies the physical cell ID by detecting the primary synchronization signal (PSS) and secondary synchronization signal (SSS), and decoding the MIB from the PBCH.
This example evaluates the performance of each stage in the SS/PBCH detection process under fading channel conditions, carrier frequency offset (CFO), phase noise, and additive white gaussian noise (AWGN).
The detection chain consists of three stages:
PSS Detection: The UE identifies the PSS by correlating against all three possible m-sequences, which is defined in TS 38.211 by . This stage provides coarse cell identity and synchronization.
SSS Detection: The UE correlates across all possible 336 candidates for the SSS, which is defined in TS 38.211 by . . The full physical cell ID is obtained by .
BCH Decode: The UE first determines the demodulation reference signal (DM-RS) associated with the SSB, then uses the DM-RS to demodulate the PBCH payload and recover the MIB using minimum mean square error (MMSE) equalization and cyclic redundancy check (CRC) verification.
The example also measures reference signal received quality (RSRQ), as defined in TS 38.215. The RSRQ captures both signal strength and noise levels, and networks use the RSRQ to support cell selection and handover decisions.
3GPP TS 38.101-4 specifies minimum SS/PBCH detection requirements under standardized fading conditions. To compare the detection performance results of this example, you can select any of the TS 38.101-4 tables as a test baseline.
Configure Simulation Parameters
Configure the simulation parameters:
Test standard configuration: Use
testStandardConfigto specify one of the TS 38.101-4 conformance tables (for example,"5.4.2.1-2") and to overwrite the carrier, channel, and receiver fields with standardized test conditions. When set to"Custom", you can define your own scenario.Carrier and SSB configuration:
frequencyRange("FR1"or"FR2"),channelBandwidth(MHz), andssbPattern("Case A"through"Case E") define the SSB numerology. The block pattern determines the subcarrier spacing and maximum candidate SSB positions ().Impairment configuration:
propagationChannelsets the channel model ("AWGN"or a TDL fading model such as"TDLC300-100",which specify the delay spread in ns and Doppler in Hz).frequencyOffsetadds a receiver CFO in subcarrier spacing.carrierFrequencyenables the phase noise model when set to a nonzero carrier frequency in Hz.Receiver configuration:
numRxAntennas(1, 2, or 4) controls diversity gain.ssbIndexKnownbypasses blind DM-RS detection when the SSB index is already known (~1.5 dB gain).pbchSoftCombiningaccumulates PBCH LLRs across multiple receptions within the 80 ms MIB transmission time interval (TTI).Simulation configuration:
snrRangedefines the signal-to-noise ratio (SNR) sweep in dB.numTrialssets the number of Monte Carlo trials per SNR point.
% Test standard configuration — set to a TS 38.101-4 table name to use standardized test conditions cfg = struct(); cfg.TestStandardConfig ="Custom"; % Carrier and SSB configuration cfg.FrequencyRange = "FR1"; cfg.ChannelBandwidth = 10; % MHz cfg.SSBPattern = "Case A"; cfg.SubcarrierSpacing = 15; % kHz, implied by the SSB pattern % Impairment configuration cfg.PropagationChannel =
"AWGN"; cfg.FrequencyOffset = 0; % Receiver CFO in subcarrier spacing (fractional values allowed) cfg.CarrierFrequency = 0; % Hz (0 disables phase noise, typical values: 3.5e9 in FR1, 28e9 in FR2) % Receiver configuration cfg.NumRxAntennas = 4; % 1, 2, or 4 cfg.SSBIndexKnown = true; % Bypass blind DM-RS detection when SSB index is known cfg.PBCHSoftCombining = true; % Accumulate PBCH LLRs across 80 ms MIB TTI % Simulation sweep rng("default") cfg.SNRRange = -25:1:-10; % SNR in dB cfg.NumTrials = 100; % Monte Carlo trials per SNR point cfg.DisplayProgress = true; % Display simulation results per SNR point [cfg, reqSNR] = hTestStandardConfig(cfg);
Simulate SS/PBCH Block Detection
The hSSBDetectionPerformance helper function runs the full detection chain for each SNR point. The detection simulation consists of these steps:
Generate and pass a clean SSB waveform through the configured channel (fading, CFO, and phase noise). Add AWGN at the target SNR.
Perform PSS correlation to identify . Correct all time and frequency offsets, then demodulate the OFDM grid.
Correlate SSS to identify and form the full cell ID.
Decode BCH using the detected cell ID in the following sub-stages:
Determine the correct DM-RS for the SSB from all potential candidates.
Perform MMSE equalization using the DM-RS and use polar decoding on the MIB. Use the CRC to verify successful decode.
When pbchSoftCombining is enabled, the decoder accumulates log-likelihood ratios from these receptions which results in combined gain. The default 20 ms SSB periodicity gives four burst receptions, this accumulation gives up to 6 dB gain.
The simulation terminates early when all stages achieve zero failures for two consecutive SNR points.
results = hSSBDetectionPerformance(cfg,Verbose=cfg.DisplayProgress);
Simulating SS/PBCH block detection performance at SNR = -25 dB:
PSS fail rate:   0.510 | SSS fail rate:   1.000 | BCH fail rate:   1.000 | RSRQ:  -32.8 dB
Simulating SS/PBCH block detection performance at SNR = -24 dB:
PSS fail rate:   0.520 | SSS fail rate:   0.970 | BCH fail rate:   1.000 | RSRQ:  -33.1 dB
Simulating SS/PBCH block detection performance at SNR = -23 dB:
PSS fail rate:   0.610 | SSS fail rate:   1.000 | BCH fail rate:   1.000 | RSRQ:  -33.1 dB
Simulating SS/PBCH block detection performance at SNR = -22 dB:
PSS fail rate:   0.420 | SSS fail rate:   1.000 | BCH fail rate:   1.000 | RSRQ:  -33.3 dB
Simulating SS/PBCH block detection performance at SNR = -21 dB:
PSS fail rate:   0.430 | SSS fail rate:   1.000 | BCH fail rate:   1.000 | RSRQ:  -33.2 dB
Simulating SS/PBCH block detection performance at SNR = -20 dB:
PSS fail rate:   0.340 | SSS fail rate:   1.000 | BCH fail rate:   1.000 | RSRQ:  -33.1 dB
Simulating SS/PBCH block detection performance at SNR = -19 dB:
PSS fail rate:   0.190 | SSS fail rate:   0.970 | BCH fail rate:   1.000 | RSRQ:  -33.3 dB
Simulating SS/PBCH block detection performance at SNR = -18 dB:
PSS fail rate:   0.030 | SSS fail rate:   0.960 | BCH fail rate:   1.000 | RSRQ:  -32.9 dB
Simulating SS/PBCH block detection performance at SNR = -17 dB:
PSS fail rate:   0.000 | SSS fail rate:   0.860 | BCH fail rate:   1.000 | RSRQ:  -32.3 dB
Simulating SS/PBCH block detection performance at SNR = -16 dB:
PSS fail rate:   0.000 | SSS fail rate:   0.740 | BCH fail rate:   1.000 | RSRQ:  -31.4 dB
Simulating SS/PBCH block detection performance at SNR = -15 dB:
PSS fail rate:   0.000 | SSS fail rate:   0.380 | BCH fail rate:   0.990 | RSRQ:  -28.7 dB
Simulating SS/PBCH block detection performance at SNR = -14 dB:
PSS fail rate:   0.000 | SSS fail rate:   0.160 | BCH fail rate:   0.910 | RSRQ:  -26.4 dB
Simulating SS/PBCH block detection performance at SNR = -13 dB:
PSS fail rate:   0.000 | SSS fail rate:   0.030 | BCH fail rate:   0.310 | RSRQ:  -24.5 dB
Simulating SS/PBCH block detection performance at SNR = -12 dB:
PSS fail rate:   0.000 | SSS fail rate:   0.000 | BCH fail rate:   0.030 | RSRQ:  -23.2 dB
Simulating SS/PBCH block detection performance at SNR = -11 dB:
PSS fail rate:   0.000 | SSS fail rate:   0.000 | BCH fail rate:   0.000 | RSRQ:  -22.1 dB
Simulating SS/PBCH block detection performance at SNR = -10 dB:
PSS fail rate:   0.000 | SSS fail rate:   0.000 | BCH fail rate:   0.000 | RSRQ:  -21.1 dB
pssFailProb = results.pssFailRate*100;
sssFailProb = results.sssFailRate*100;
bchFailProb = results.bchFailRate*100;
snrSimulated = results.snrRange;
rsrq = results.rsrq;

resultsTable = table(snrSimulated(:), pssFailProb(:), sssFailProb(:), ...
    bchFailProb(:), rsrq(:), ...
    VariableNames=["SNR (dB)" "PSS Fail (%)" "SSS Fail (%)" "BCH Fail (%)" "RSRQ (dB)"])
resultsTable = 16×5 table
    SNR (dB)    PSS Fail (%)    SSS Fail (%)    BCH Fail (%)    RSRQ (dB)
    ________    ____________    ____________    ____________    _________

      -25            51             100             100          -32.827
      -24            52              97             100          -33.071
      -23            61             100             100          -33.126
      -22            42             100             100          -33.282
      -21            43             100             100           -33.19
      -20            34             100             100          -33.134
      -19            19              97             100          -33.267
      -18             3              96             100          -32.925
      -17             0              86             100          -32.306
      -16             0              74             100          -31.412
      -15             0              38              99          -28.694
      -14             0              16              91          -26.405
      -13             0               3              31          -24.502
      -12             0               0               3          -23.201
      -11             0               0               0          -22.081
      -10             0               0               0          -21.097
Identify Detection Threshold
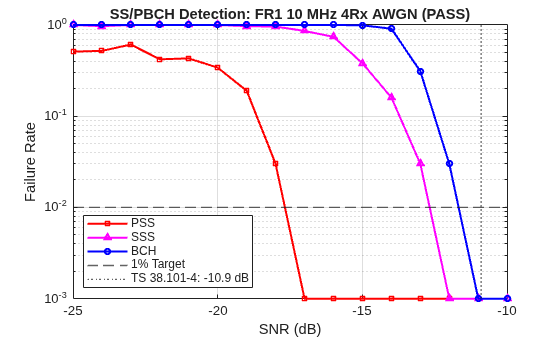
Compare the measured performance of the PSS, SSS, and PBCH at a 1% miss detection probability against the TS 38.101-4 requirement.
% 1% failure rate threshold, as defined in TS 38.101-4
target = 0.01;
pssThresh = findThreshold(snrSimulated, results.pssFailRate, target);
sssThresh = findThreshold(snrSimulated, results.sssFailRate, target);
bchThresh = findThreshold(snrSimulated, results.bchFailRate, target);

if ~isnan(bchThresh) && bchThresh <= reqSNR
    verdict = "PASS";
else
    verdict = "FAIL";
end

summaryTable = table( ...
    ["PSS"; "SSS"; "BCH"], ...
    [thresholdStr(pssThresh); thresholdStr(sssThresh); thresholdStr(bchThresh)], ...
    VariableNames=["Stage" "Threshold (dB)"])
summaryTable = 3×2 table
    Stage    Threshold (dB)
    _____    ______________

    "PSS"       "-17.0"
    "SSS"       "-12.0"
    "BCH"       "-11.0"
Analyze Detection Failure Rate against SNR
Plot the failure rate for each detection stage as a function of SNR. Because the PSS correlates against only three candidates, the PSS converges first. Next, the SSS converges with 336 candidates, benefiting from noncoherent combining. Because decoding the BCH requires full channel estimation and demodulation, the PBCH converges last. The plot shows the 1% target and the TS 38.101-4 requirement for SNR.
floorVal = 1/(10*cfg.NumTrials);
plotDetectionPerformance(snrSimulated,results,floorVal,target,reqSNR,cfg,verdict);
Analyze RSRQ against Detection Performance
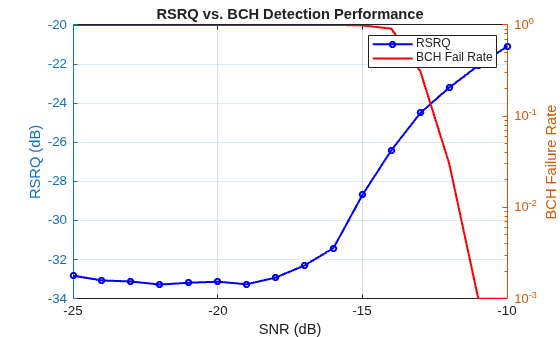
The RSRQ, as defined in TS 38.215, is the -to- ratio. is the number of resource blocks. is the reference signal received power (RSRP). is the total received wideband power. RSRQ captures both signal strength and noise level in a single metric. Unlike the RSRP, the RSRQ degrades when noise increases, even if the signal power remains constant.
Plot RSRQ alongside the BCH failure rate to show the relationship between measured signal quality and decode success. The transition from high failure rate to reliable decoding approximately corresponds to an RSRQ in the range from -28 dB to -24 dB.
plotRSRQPerformance(snrSimulated,rsrq,results,floorVal);
References
[1] 3GPP TS 38.101-4 "NR; User Equipment (UE) radio transmission and reception; Part 4: Performance requirements." 3rd Generation Partnership Project; Technical Specification Group Radio Access Network.
[2] 3GPP TS 38.211 "NR; Physical channels and modulation." 3rd Generation Partnership Project; Technical Specification Group Radio Access Network.
[3] 3GPP TS 38.213 "NR; Physical layer procedures for control." 3rd Generation Partnership Project; Technical Specification Group Radio Access Network.
[4] 3GPP TS 38.215 "NR; Physical layer measurements." 3rd Generation Partnership Project; Technical Specification Group Radio Access Network.
[5] 3GPP TR 38.803 "Study on new radio access technology: Radio Frequency (RF) and co-existence aspects." 3rd Generation Partnership Project; Technical Specification Group Radio Access Network.
Local Functions
function thresh = findThreshold(snrVec, metric, target)
    lastAbove = find(metric > target, 1, "last");
    if isempty(lastAbove)
        thresh = snrVec(1);
    elseif lastAbove == length(snrVec)
        thresh = NaN;
    else
        thresh = snrVec(lastAbove + 1);
    end
end

function s = thresholdStr(thresh)
    if isnan(thresh)
        s = "Did not converge";
    else
        s = sprintf("%.1f", thresh);
    end
end

function hFig = plotRSRQPerformance(snrSimulated, rsrq, results, floorVal)
    hFig = figure;
    yyaxis left
    plot(snrSimulated, rsrq, "b-o", LineWidth=1.5, MarkerSize=4)
    ylabel("RSRQ (dB)")
    yyaxis right
    semilogy(snrSimulated, max(results.bchFailRate, floorVal), "r-", LineWidth=1.5)
    ylabel("BCH Failure Rate")
    grid on
    xlabel("SNR (dB)")
    title("RSRQ vs. BCH Detection Performance")
    legend("RSRQ", "BCH Fail Rate", Location="northeast")
end

function hFig = plotDetectionPerformance(snrSimulated, results, floorVal, target, reqSNR, cfg, verdict)
    hFig = figure;
    semilogy(snrSimulated, max(results.pssFailRate, floorVal), "r-s", LineWidth=1.5, MarkerSize=4);
    hold on
    semilogy(snrSimulated, max(results.sssFailRate, floorVal), "m-^", LineWidth=1.5, MarkerSize=4);
    semilogy(snrSimulated, max(results.bchFailRate, floorVal), "b-o", LineWidth=1.5, MarkerSize=4);
    yline(target, "--", LineWidth=1);
    xline(reqSNR, ":", LineWidth=1);
    hold off
    grid on
    xlabel("SNR (dB)")
    ylabel("Failure Rate")
    title("SS/PBCH Detection: " + cfg.FrequencyRange + " " + cfg.ChannelBandwidth + " MHz " + cfg.NumRxAntennas + "Rx " + cfg.PropagationChannel + " (" + verdict + ")")
    legend("PSS", "SSS", "BCH", "1% Target", "TS 38.101-4: " + reqSNR + " dB", Location="southwest")
    ylim([floorVal 1])
end

