Mission Analysis with the Orbit Propagator Block
This example shows how to compute and visualize line-of-sight access intervals between satellite(s) and a ground station. It uses:
Aerospace Blockset™
Orbit PropagatorblockAerospace Toolbox
satelliteScenarioobjectMapping Toolbox™
worldmapandgeoshowfunctions

The Aerospace Toolbox satelliteScenario object allows users to add satellites and constellations to scenarios in two ways. First, satellite initial conditions can be defined from a two line element file (.tle) or from Keplerian orbital elements and the satellites can then be propagated using Kepler's problem, simplified general perturbation algorithm SGP-4, or simplified deep space perturbation algorithm SDP-4. Additionally, previously generated timestamped ephemeris data can be added to a scenario from a timeseries or timetable object. Data is interpolated in the scenario object to align with the scenario time steps. This second option can be used to incorporate data generated in a Simulink® model into either a new or existing satelliteScenario. This example shows how to propagate satellite trajectories using numerical integration with the Aerospace Blockset Orbit Propagator block, and load that logged ephemeris data into a satelliteScenario object for access analysis.
Define Mission Parameters and Satellite Initial Conditions
Specify a start date and duration for the mission. This example uses MATLAB® structures to organize mission data. These structures make accessing data later in the example more intuitive. They also help declutter the global base workspace.
mission.StartDate = datetime(2019, 1, 4, 12, 0, 0);
mission.Duration  = hours(6);
Specify Keplerian orbital elements for the satellite(s) at the mission.StartDate.
mission.Satellite.SemiMajorAxis  = 6786233.13; % meters
mission.Satellite.Eccentricity   = 0.0010537;
mission.Satellite.Inclination    = 51.7519;    % deg
mission.Satellite.RAAN           = 95.2562;    % deg
mission.Satellite.ArgOfPeriapsis = 93.4872;    % deg
mission.Satellite.TrueAnomaly    = 202.9234;   % deg
Specify the latitude and longitude of a ground station to use in access analysis below.
mission.GroundStation.Latitude =42; % deg mission.GroundStation.Longitude =
-71; % deg
Open and Configure the Orbit Propagation Model
Open the included Simulink model. This model contains an Orbit Propagator block connected to output ports. The Orbit Propagator block supports vectorization. This allows you to model multiple satellites in a single block by specifying arrays of initial conditions in the Block Parameters window or using set_param. The model also includes a "Mission Analysis and Visualization" section that contains a dashboard Callback button. When clicked, this button runs the model, creates a new satelliteScenario object in the global base workspace containing the satellite or constellation defined in the Orbit Propagator block, and opens a Satellite Scenario Viewer window for the new scenario. To view the source code for this action, double click the callback button. The "Mission Analysis and Visualization" section is a standalone workflow to create a new satelliteScenario object and is not used as part of this example.
mission.mdl = "OrbitPropagatorBlockExampleModel";
open_system(mission.mdl);
snapshotModel(mission.mdl);
Define the path to the Orbit Propagator block in the model.
mission.Satellite.blk = mission.mdl + "/Orbit Propagator";Set satellite initial conditions. To assign the Keplerian orbital element set defined in the previous section, use set_param.
set_param(mission.Satellite.blk, ...
    "startDate",      num2str(juliandate(mission.StartDate)), ...
    "stateFormatNum", "Orbital elements", ...
    "orbitType",      "Keplerian", ...
    "semiMajorAxis",  "mission.Satellite.SemiMajorAxis", ...
    "eccentricity",   "mission.Satellite.Eccentricity", ...
    "inclination",    "mission.Satellite.Inclination", ...
    "raan",           "mission.Satellite.RAAN", ...
    "argPeriapsis",   "mission.Satellite.ArgOfPeriapsis", ...
    "trueAnomaly",    "mission.Satellite.TrueAnomaly");
Set the position and velocity output ports of the block to use the Earth-centered Earth-fixed frame, which is the International Terrestrial Reference Frame (ITRF).
set_param(mission.Satellite.blk, ...
    "centralBody",  "Earth", ...
    "outportFrame", "Fixed-frame");
Configure the propagator. This example uses a numerical propagator for higher position accuracy. Use numerical propagators to model Earth gravitational potential using the equation for universal gravitation ("Pt-mass"), a second order zonal harmonic model ("Oblate Ellipsoid (J2)"), or a spherical harmonic model ("Spherical Harmonics"). Spherical harmonics are the most accurate, but trade accuracy for speed. For increased accuracy, you can also specify whether to use Earth orientation parameters (EOP's) in the internal transformations between inertial (ICRF) and fixed (ITRF) coordinate systems.
set_param(mission.Satellite.blk, ...
    "propagator",   "Numerical (high precision)", ...
    "gravityModel", "Spherical Harmonics", ...
    "earthSH",      "EGM2008", ... % Earth spherical harmonic potential model
    "shDegree",     "120", ... % Spherical harmonic model degree and order
    "useEOPs",      "on", ... % Use EOP's in ECI to ECEF transformations
    "eopFile",      "aeroiersdata.mat"); % EOP data file
Apply model-level solver setting using set_param. For best performance and accuracy when using a numerical propagator, use a variable-step solver.
set_param(mission.mdl, ...
    "SolverType", "Variable-step", ...
    "SolverName", "VariableStepAuto", ...
    "RelTol",     "1e-6", ...
    "AbsTol",     "1e-7", ...
    "StopTime",   string(seconds(mission.Duration)));
Save model output port data as a dataset of time series objects.
set_param(mission.mdl, ...
    "SaveOutput", "on", ...
    "OutputSaveName", "yout", ...
    "SaveFormat", "Dataset");
Run the Model and Collect Satellite Ephemerides
Simulate the model. In this example, the Orbit Propagator block is set to output position and velocity states in the ECEF (ITRF) coordinate frame.
mission.SimOutput = sim(mission.mdl);
Extract position and velocity data from the model output data structure.
mission.Satellite.TimeseriesPosECEF = mission.SimOutput.yout{1}.Values;
mission.Satellite.TimeseriesVelECEF = mission.SimOutput.yout{2}.Values;
Set the start data from the mission in the timeseries object.
mission.Satellite.TimeseriesPosECEF.TimeInfo.StartDate = mission.StartDate;
mission.Satellite.TimeseriesVelECEF.TimeInfo.StartDate = mission.StartDate;
Load the Satellite Ephemerides into a satelliteScenario Object
Create a satellite scenario object to use during the analysis portion of this example.
scenario = satelliteScenario;
Add the satellites to the satellite scenario as ECEF position and velocity timeseries using the satellite method.
sat = satellite(scenario, mission.Satellite.TimeseriesPosECEF, mission.Satellite.TimeseriesVelECEF, ...
    "CoordinateFrame", "ecef")
sat =
  Satellite with properties:

                  Name:  Satellite
                    ID:  1
        ConicalSensors:  [1x0 matlabshared.satellitescenario.ConicalSensor]
               Gimbals:  [1x0 matlabshared.satellitescenario.Gimbal]
          Transmitters:  [1x0 satcom.satellitescenario.Transmitter]
             Receivers:  [1x0 satcom.satellitescenario.Receiver]
              Accesses:  [1x0 matlabshared.satellitescenario.Access]
               Eclipse:  [1x0 Aero.satellitescenario.Eclipse]
           GroundTrack:  [1x1 matlabshared.satellitescenario.GroundTrack]
                 Orbit:  [1x1 matlabshared.satellitescenario.Orbit]
        CoordinateAxes:  [1x1 matlabshared.satellitescenario.CoordinateAxes]
       OrbitPropagator:  ephemeris
           MarkerColor:  [0.059 1 1]
            MarkerSize:  6
             ShowLabel:  true
        LabelFontColor:  [1 1 1]
         LabelFontSize:  15
         Visual3DModel:
    Visual3DModelScale:  1
disp(scenario)
  satelliteScenario with properties:

             StartTime: 04-Jan-2019 12:00:00
              StopTime: 04-Jan-2019 18:00:00
            SampleTime: 60
          AutoSimulate: 1
    CentralBodyOptions: [1×1 Aero.satellitescenario.CentralBodyOptions]
            Satellites: [1×1 matlabshared.satellitescenario.Satellite]
        GroundStations: [1×0 matlabshared.satellitescenario.GroundStation]
             Platforms: [1×0 matlabshared.satellitescenario.Platform]
               Viewers: [0×0 matlabshared.satellitescenario.Viewer]
              AutoShow: 1
Preview latitude (deg), longitude (deg), and altitude (m) for each satellite. Use the states method to query satellite states at each scenario time step.
for idx = numel(sat):-1:1
    % Retrieve states in geographic coordinates
    [llaData, ~, llaTimeStamps] = states(sat(idx), "CoordinateFrame","geographic");
    % Organize state data for each satellite in a separate timetable
    mission.Satellite.LLATable{idx} = timetable(llaTimeStamps', llaData(1,:)', llaData(2,:)', llaData(3,:)',...
        'VariableNames', {'Lat_deg','Lon_deg', 'Alt_m'});
    mission.Satellite.LLATable{idx}
end
ans=361×3 timetable
            Time            Lat_deg    Lon_deg      Alt_m
    ____________________    _______    _______    __________

    04-Jan-2019 12:00:00    -44.804    120.35     4.2526e+05
    04-Jan-2019 12:01:00    -42.809     124.7     4.2232e+05
    04-Jan-2019 12:02:00    -40.638    128.75     4.2393e+05
    04-Jan-2019 12:03:00    -38.337     132.5     4.2008e+05
    04-Jan-2019 12:04:00    -35.867    136.05     4.2003e+05
    04-Jan-2019 12:05:00    -33.311    139.33     4.2031e+05
    04-Jan-2019 12:06:00    -30.682    142.38     4.1871e+05
    04-Jan-2019 12:07:00    -27.917    145.31     4.1981e+05
    04-Jan-2019 12:08:00    -25.104    148.06     4.1836e+05
    04-Jan-2019 12:09:00    -22.267    150.65     4.1404e+05
    04-Jan-2019 12:10:00    -19.321    153.17     4.1823e+05
    04-Jan-2019 12:11:00    -16.358    155.57     4.1717e+05
    04-Jan-2019 12:12:00    -13.397    157.88       4.07e+05
    04-Jan-2019 12:13:00     -10.36    160.15     4.1036e+05
    04-Jan-2019 12:14:00    -7.3121    162.37     4.1291e+05
    04-Jan-2019 12:15:00    -4.2727    164.54     4.0493e+05
      ⋮
clear llaData llaTimeStamps;
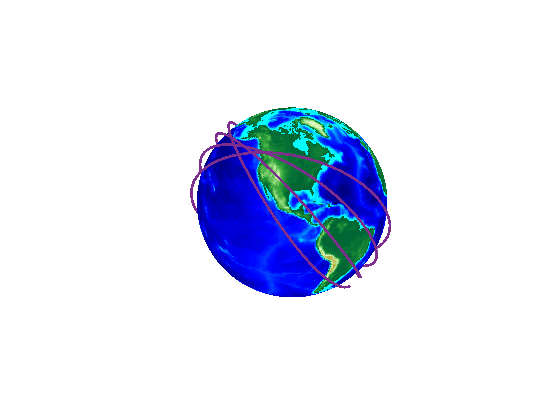
Display Satellite Trajectories over the 3D Globe
To display the satellite trajectories over Earth (WGS84 ellipsoid), use helper function plot3DTrajectory.
mission.ColorMap = lines(256); % Define colormap for satellite trajectories
mission.ColorMap(1:3,:) = [];
plot3DTrajectories(mission.Satellite, mission.ColorMap);
Display Global and Regional 2-D Ground Traces
View the global ground trace as a 2-D projection using helper function plot2DTrajectories:
plot2DTrajectories(mission.Satellite, mission.GroundStation, mission.ColorMap);

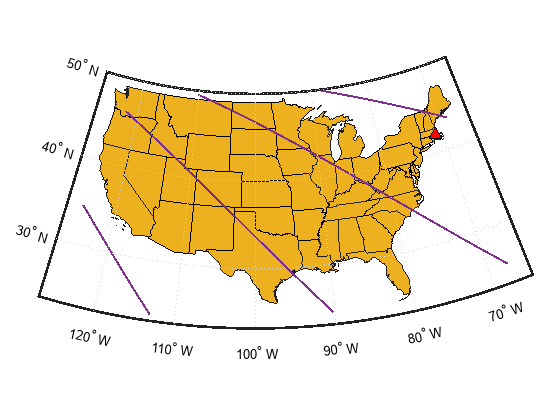
View regional ground trace. Select the region of interest from the dropdown menu:
plot2DTrajectories(mission.Satellite, mission.GroundStation, mission.ColorMap,  "usa");
Compute Satellite to Ground Station Access (Line-of-Sight Visibility)
Add the ground station to the satelliteScenario object using the groundStation method.
gs = groundStation(scenario, mission.GroundStation.Latitude, mission.GroundStation.Longitude, ...
    "MinElevationAngle", 10, "Name", "Ground Station")
gs =
  GroundStation with properties:

                  Name:  Ground Station
                    ID:  2
              Latitude:  42 degrees
             Longitude:  -71 degrees
              Altitude:  0 meters
     MinElevationAngle:  10 degrees
    MaskElevationAngle:  10 degrees
      MaskAzimuthEdges:  [0 360]
        ConicalSensors:  [1x0 matlabshared.satellitescenario.ConicalSensor]
               Gimbals:  [1x0 matlabshared.satellitescenario.Gimbal]
          Transmitters:  [1x0 satcom.satellitescenario.Transmitter]
             Receivers:  [1x0 satcom.satellitescenario.Receiver]
              Accesses:  [1x0 matlabshared.satellitescenario.Access]
               Eclipse:  [1x0 Aero.satellitescenario.Eclipse]
        CoordinateAxes:  [1x1 matlabshared.satellitescenario.CoordinateAxes]
           MarkerColor:  [1 0.4118 0.1608]
            MarkerSize:  6
             ShowLabel:  true
        LabelFontColor:  [1 1 1]
         LabelFontSize:  15
Attach line-of-sight access analyses between all individual satellites and the ground station using the access method.
ac = access(sat, gs);
ac.LineColor = "green";
Display Access Intervals
Display access intervals for each satellite as a timetable. Use accessStatus and accessIntervals satellite methods to interact with access analysis results.
for idx = numel(ac):-1:1
    mission.Satellite.AccessStatus{idx} = accessStatus(ac(idx));
    mission.Satellite.AccessTable{idx} = accessIntervals(ac(idx));
    % Use local function addLLAToTimetable to add geographic positions and
    % closest approach range to the Access Intervals timetable
    mission.Satellite.AccessTable{idx} = addLLAToTimetable(...
        mission.Satellite.AccessTable{idx}, mission.Satellite.LLATable{idx}, mission.GroundStation);
end
clear idx;
Display access intervals overlaying 2-D ground traces of the satellite trajectories using helper function plotAccessIntervals.
plotAccessIntervals(mission.Satellite, mission.GroundStation, mission.ColorMap);

mission.Satellite.AccessTable{:}ans=2×8 table
Source Target IntervalNumber StartTime EndTime Duration LLA (deg, deg, m) ClosestApproach (m)
___________ ________________ ______________ ____________________ ____________________ ________ _________________ ___________________
"Satellite" "Ground Station" 1 04-Jan-2019 12:44:00 04-Jan-2019 12:50:00 360 {6×3 double} 4.9996e+05
"Satellite" "Ground Station" 2 04-Jan-2019 14:21:00 04-Jan-2019 14:25:00 240 {4×3 double} 1.1021e+06
Further Analysis
Play the satelliteScenario object to open and animate the scenario in a satelliteScenarioViewer window.
play(scenario);
disp(scenario.Viewers(1))
  Viewer with properties:

                       Name: 'Satellite Scenario Viewer'
                   Position: [560 240 800 600]
                    Basemap: 'satellite'
    PlaybackSpeedMultiplier: 50
       CameraReferenceFrame: 'ECEF'
                CurrentTime: 04-Jan-2019 12:00:05
                ShowDetails: 1
                  Dimension: '3D'
Show the satellite ground track in the viewer.
groundTrack(sat);

References
[1] Wertz, James R, David F. Everett, and Jeffery J. Puschell. Space Mission Engineering: The New Smad. Hawthorne, CA: Microcosm Press, 2011. Print.