Measure Performance of Streaming Real-Time Audio Algorithms
This example presents a utility that can be used to analyze the timing performance of signal processing algorithms designed for real-time streaming applications.
Introduction
The ability to prototype an audio signal processing algorithm in real time using MATLAB depends primarily on its execution performance. Performance is affected by a number of factors, such as the algorithm's complexity, the sampling frequency and the input frame size. Ultimately, the algorithm must be fast enough to ensure it can always execute within the available time budget and not drop any frames. Frames are dropped whenever the audio input queue is overrun with new samples (not read fast enough) or the audio output queue is underrun (not written fast enough). Dropped frames result in undesirable artifacts in the output audio signal.
This example presents a utility to profile the execution performance of an audio signal processing algorithm within MATLAB and compare it to the available time budget.
Results in this example were obtained on a machine running an Intel (R) Xeon (R) CPU with a clock speed of 3.50 GHz, and 64 GB of RAM. Results vary depending on system specifications.
Measure Performance of a Notch Filter Application
In this example, you measure performance of an eighth-order notch filter, implemented using dsp.SOSFilter
.
helperAudioLoopTimerExample defines and instantiates the variables used in the algorithm. The input is read from a file using a dsp.AudioFileReader object, and then streamed through the notch filter in a processing loop.
audioexample.AudioLoopTimer is the utility object used to profile execution performance and display a summary of the results. The utility uses simple tic/toc commands to log the timing of different stages of the simulation. The initialization time (which is the time it takes to instantiate and set up variables and objects before the simulation loop begins) is measured using the ticInit and tocInit methods. The individual simulation loop times are measured using the ticLoop and tocLoop methods. After the simulation loop is done, a performance report is generated using the object's generateReport method.
Execute helperAudioLoopTimerExample to run the simulation and view the performance report:
helperAudioLoopTimerExample;

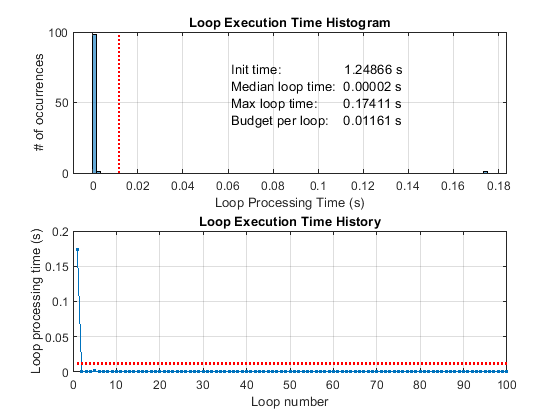
The performance report figure displays a histogram of the loop execution times in the top plot. The red line represents the maximum allowed loop execution time, or budget, above which samples will be dropped. The budget per simulation loop is equal to L/Fs, where L is the input frame size, and Fs is the sampling rate. In this example, L = 512, Fs = 44100 Hz, and the budget per loop is around 11.6 milliseconds. The performance report also displays the runtime of the individual simulation loops in the bottom plot. Again, the red line represents the allowed budget per loop.
Notice that although the median loop time is well within the budget, the maximum loop time exceeds the budget. From the bottom plot, it is evident that the budget is exceeded on the very first loop pass, and that subsequent loop runs are within the budget. The relative slow performance of the first simulation loop is due to the penalty incurred the first time you call the dsp.SOSFilter
and dsp.AudioFileReader objects. The first call to the object triggers the execution of one-time tasks that do not depend on the inputs, such as hardware resource allocation and state initialization. This problem can be alleviated by executing one-time tasks before the simulation loop. You can perform the one-time tasks by calling the simulation objects in the initialization stage. Execute helperAudioLoopTimerExample(true) to re-run the simulation with pre-loop setup enabled.
helperAudioLoopTimerExample(true);

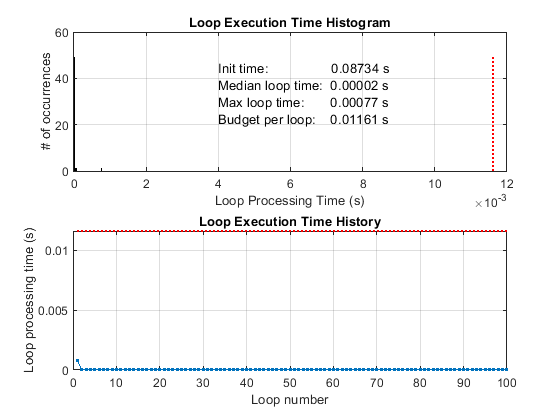
All loop runs are now within the budget. Notice that the maximum and total loop times have been drastically reduced compared to the first performance report, at the expense of a higher initialization time.