Track Drive Cycle Errors
This example shows how to use the Drive Cycle Source block to identify drive
cycle faults when you run the conventional vehicle reference application with the
FTP–75 drive cycle.
Open the conventional vehicle reference application project. By default, the application has a
Project files open in a writable location.FTP–75drive cycle with error tracking disabled.Open the Drive Cycle Source block. On the Fault Tracking tab, select these parameters:
Enable fault tracking
Enable failure tracking
Review the parameters that specify the fault and failure conditions. If the vehicle speed is not within the allowable speed range during the time tolerance, the block sets a fault condition. Accept the default EPA dynamometer driving schedule parameter settings by clicking OK.
This table provides the settings for the EPA standard and the Worldwide Harmonised Light Vehicle Test Procedure (WLTP) laboratory tests.
Parameter Description Setting EPA Standard1
WLTP Tests2
Speed tolerance
Speed tolerance above the highest point and below the lowest point of the drive cycle speed trace within the time tolerance.
2.0 mph
2.0 km/h
Time tolerance
Time that the block uses to determine the allowable speed range.
1.0 s
1.0 s
Maximum number of faults Maximum number of faults allowed during the drive cycle without causing fault failure.
Not specified 10 Maximum single fault time Maximum fault duration allowed without causing fault failure.
2.0 s 1.0 s Maximum total fault time Maximum allowed accumulated time under fault condition without causing fault failure.
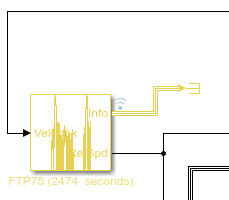
Not specified Not specified Connect the vehicle longitudinal velocity signal to the Drive Cycle Source block
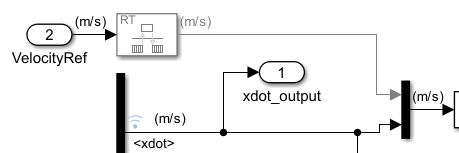
VelFdbkinput port.In the Visualization subsystem, connect the longitudinal velocity signal,
<xdot>, to an Outport namedxdot_output.Determine the
<xdot>signal units. To display signal units, on the Debug tab, select Information Overlays > Units. The<xdot>signal units are m/s.Select the
<xdot>signal line andEnable Data Logging.
On the top level of the model, connect the Visualization output to the Drive Cycle Source block input.

Connect the Drive Cycle Source block
Infooutput port to a Terminator port. Enable data logging.
Save the model and run the simulation.
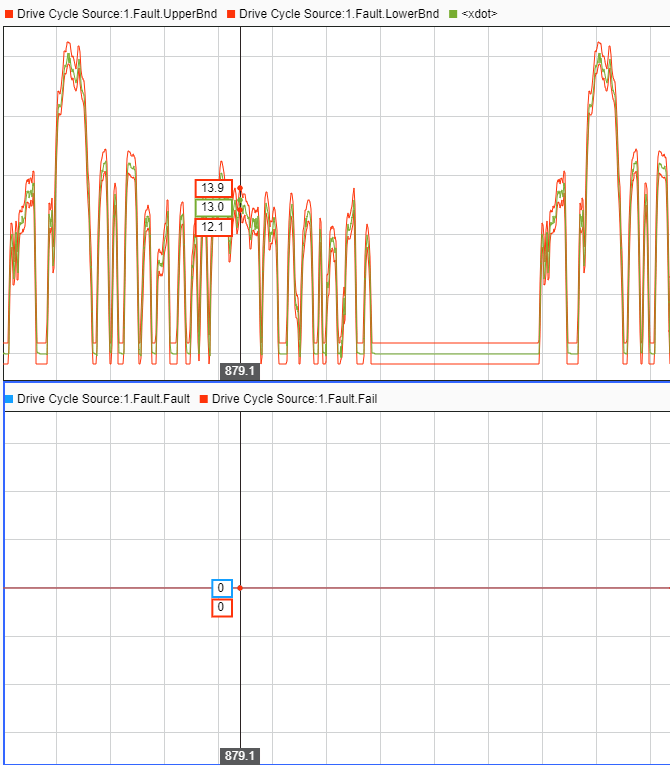
To inspect the results, use the Data Inspector. In the Simulink® Toolstrip, on the Simulation tab, under Review Results, click Data Inspector.
These results indicate that the Drive Cycle Source block did not detect faults or failures during the drive cycle.
Fault— Vehicle speed,<xdot>, stayed within the upper and lower bounds of the allowable speed range.Fail— Fault conditions did not exceed the maximum number of faults, maximum single fault time, or maximum total fault time.

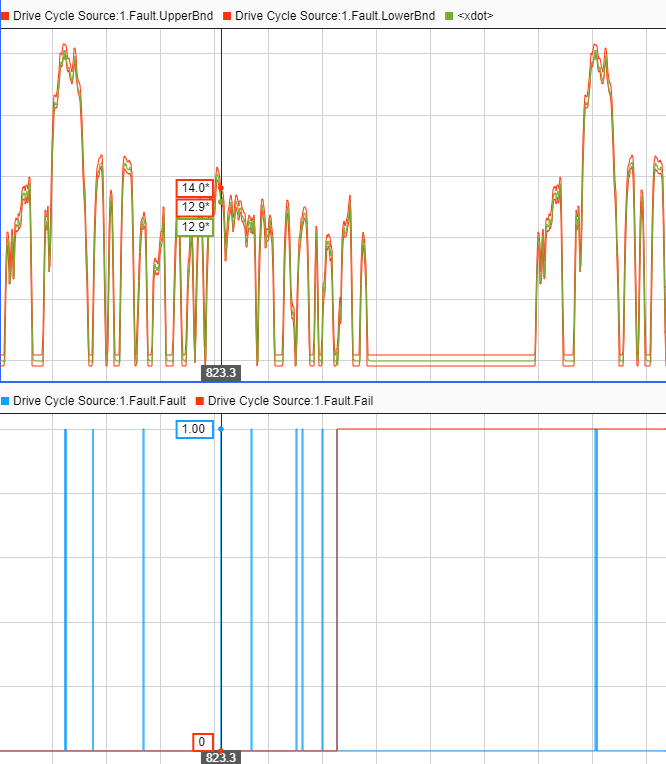
In the Drive Cycle Source block, set the Speed tolerance parameter to a tighter tolerance, for example 1 mph. The block calculates new error bounds for the speed.
Rerun the simulation.
To inspect the results, use the Data Inspector. These results indicate that the Drive Cycle Source block did detect failures and faults during the drive cycle.
Fault— Vehicle speed,<xdot>, did not stay within the upper and lower bounds of the allowable speed range.Fail— Fault conditions exceeded the maximum number of faults, maximum single fault time, or maximum total fault time.

References
[1] Environmental Protection Agency (EPA). EPA urban dynamometer driving schedule. 40 CFR 86.115-78, July 1, 2001.
[2] European Union Commission. "Speed trace tolerances". European Union Commission Regulation. 32017R1151, Sec 1.2.6.6, June 1, 2017.