pdbdistplot
Visualize intermolecular distances in Protein Data Bank (PDB) file
Description
pdbdistplot( retrieves the structure
specified by PDBid)PDBid from the PDB database and creates a heat map showing
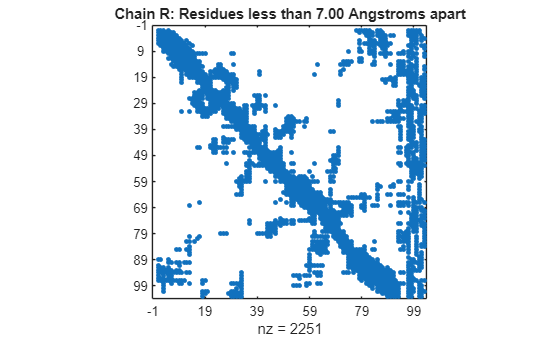
inter–residue distances and a spy plot showing the residues where the minimum distances
apart are less than 7 angstroms. If multiple chains are present in
PDBid, separate plots are created.
pdbdistplot(___,
specifies additional options using one or more name-value arguments. Use any arguments from
the previous syntaxes.Name=Value)
Examples
Display a heat map of the inter-residue distances and a spy plot at 7 angstroms of the protein cytochrome C from albacore tuna.
pdbdistplot("5CYT");
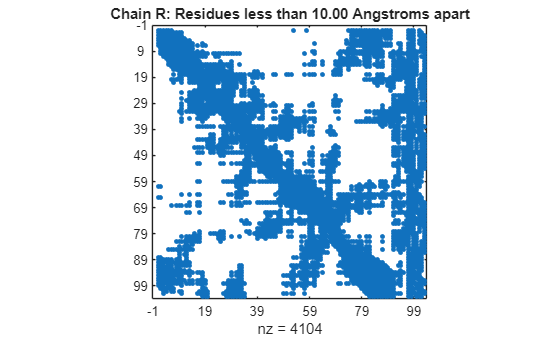
Display a spy plot at 10 angstroms of the same structure.
pdbdistplot("5CYT",10);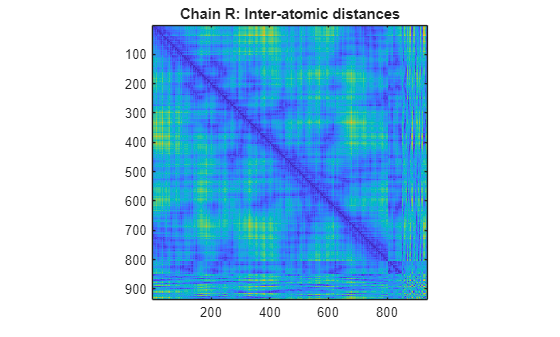
Input Arguments
Name-Value Arguments
Version History
Introduced before R2006a
See Also
getpdb | pdbread | proteinplot | ramachandran