Filter and Group Results in Polyspace Desktop User Interface
This topic describes how to filter, group, and otherwise manage results in the user interface of the Polyspace® desktop products. For a similar workflow in the Polyspace Access™ web interface, see Filter and Sort Results in Polyspace Access Web Interface (Polyspace Access).
When you open the results of a Polyspace analysis, you see a flat list of defects (Bug Finder), run-time checks (Code Prover), coding rule violations or other results. To organize your review, you can narrow down the list or group results by file or result type.

Some of the ways you can use filtering are:
You can display certain types of defects or run-time checks only.
For instance, in Bug Finder, you can display only high-impact defects. See Classification of Defects by Impact.
You can display only new results found since the last analysis.
You can display only the results that are not justified.
Filter Results
Filter Using Results List

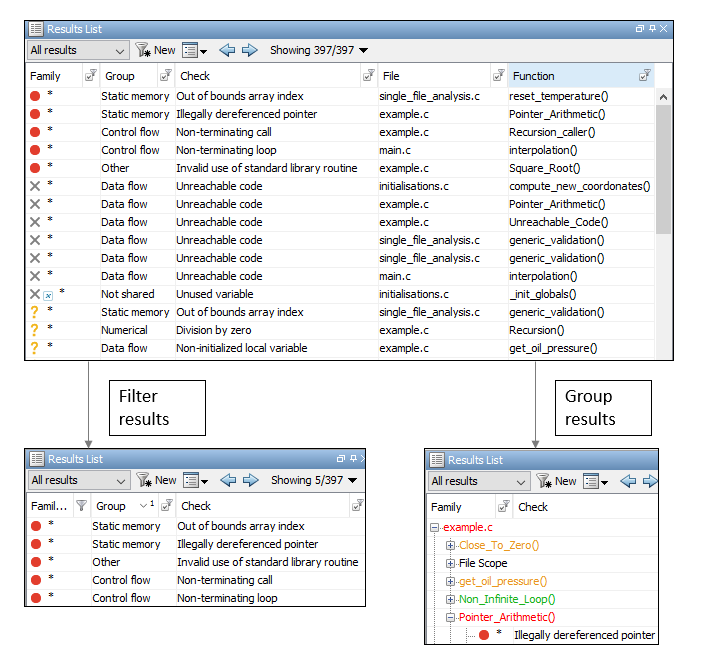
You can filter using the columns on the Results List
pane. Click the ![]() icon on the column headers to see the
available filters. For instance:
icon on the column headers to see the
available filters. For instance:
To see only Bug Finder defects with high impact, from the filters on the Information column, clear all check boxes except Impact: High.
To see only results that are not yet justified, clear the True filter on the Justification column. This column might not be visible by default. To see the column, right-click any column header and select Justification.
For information on justification, see Address Results in Polyspace User Interface Through Bug Fixes or Justifications.
For information on the columns, see:
Results List in Polyspace Desktop User Interface (Polyspace Code Prover)
Results found since the last analysis appear with an asterisk
(*) next to them. To see only these results since the
last analysis, click the New button. Note that if you run
an analysis at the command line (or even when you run an analysis in the user
interface for the first time), you have to first import from a previous analysis
to create a baseline for the New button. See Import Review Information from Previous Polyspace Analysis.
If you do not want to filter by the exact contents of a column, you can use a
custom filter instead. For instance, you want to filter out subfolders of a
specific folder. Instead of filtering out each subfolder in the
Folder column, select Custom from the filter dropdown. Specify the root folder name
for the doesn’t contain filter.
You can use wildcard characters for the custom filter. The wildcard
? represents 0 or 1 character and *
represents 0 or more characters.
If you apply filters in this way, they carry over to the next analysis. You can also name and save a subset of filters for use in multiple projects. To apply the named set of filters, pick this filter set from the All results list. To create a new entry in this list, select Tools > Preferences and create your own set of filters on the Review Scope tab.
Filter Using Dashboard

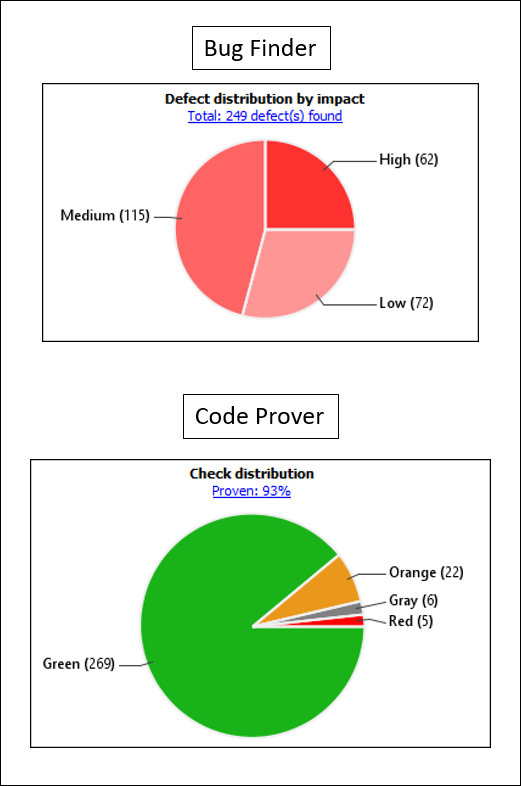
You can click graphs on the Dashboard pane to filter results. For instance:
To see only high-impact defects in Bug Finder, click the corresponding section of the Defect distribution by impact chart.
To see only red checks in Code Prover, click the corresponding section of the Check distribution chart.
To see all results again, click the link View all results in this scope.
Filter Using Orange Sources
An orange source can cause multiple orange checks in Code Prover. You can display all orange checks from the same source and review them together.
For instance, in this code, the unknown value input can
cause an overflow and a division by zero. The variable input
is an orange source that causes two orange
checks.
void func (int input) {
int val1;
double val2;
val1 = input++;
val2 = 1.0/input;
}
To begin, select Window > Show/Hide View > Orange Sources. You see the list of orange sources. Select an orange source to see all orange checks coming from this source.

See Filters Used

On the Results List header, you see the number of results
displayed in the format Showing
x/y,
for instance Showing 100/250. Click the dropdown beside
this number to see the filters that are currently active. You can also clear the
active filters from this dropdown (all except the named set of filters that you
picked from the All results dropdown).
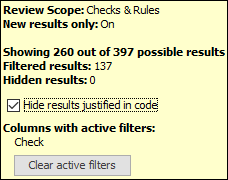
You see this information about the filters:
Review Scope: If you pick a named set of filters from the All results dropdown, you see this filter set.
New results only: If you use the New button to see only new results, you see this filter enabled.
Filtered results: You see the number of results filtered in the Polyspace user interface (by any means: results list, dashboard or orange sources).
Hidden results: You see the number of results hidden using code annotations. To unhide these results, clear Hide results justified in code.
For information on hiding results through code annotations, see Address Results in Polyspace User Interface Through Bug Fixes or Justifications.
Columns with active filters: You see the columns in the Results List pane (or columns corresponding to graphs in the Dashboard pane) that you used to filter results.
Group Results
On the Results List pane, from the ![]() list, select an option, for instance, grouping by
file. Alternatively, you can click a column header to sort the column contents
alphabetically.
list, select an option, for instance, grouping by
file. Alternatively, you can click a column header to sort the column contents
alphabetically.

The available options for grouping are:
None: Shows results without grouping.
Family: Shows results grouped by result type.
The results are organized by type: checks (Code Prover), defects (Bug Finder), global variables (Code Prover), coding rule violations, code metrics. Within each type, they are grouped further.
The defects (Bug Finder) are organized by the defect groups. For more information on the groups, see Defects.
The checks (Code Prover) are grouped by color. Within each color, the checks are organized by check group. For more information on the groups, see Run-Time Checks (Polyspace Code Prover).
The global variables (Code Prover) are grouped by their usage. For more information, see Global Variables (Polyspace Code Prover).
The coding rule violations are grouped by type of coding rule. For more information, see Coding Standards.
The code metrics are grouped by scope of metric. For more information, see Code Metrics.
File: Show results grouped by file.
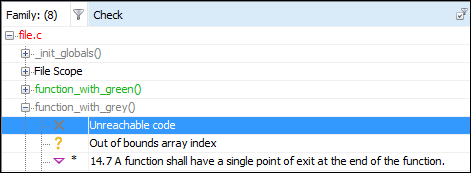
Within each file, the results are grouped by function. The results that are not associated with a particular function are grouped under File Scope.
In Code Prover, the file or function name shows the worst check color in the file or function. The severity of a check color decreases in the order: red, gray, orange, green.
Class (for C++ code only): Shows results grouped by class.
Within each class, the results are grouped by method. The results that are not associated with a particular class are grouped under Global Scope.