Source Code in Polyspace Platform User Interface
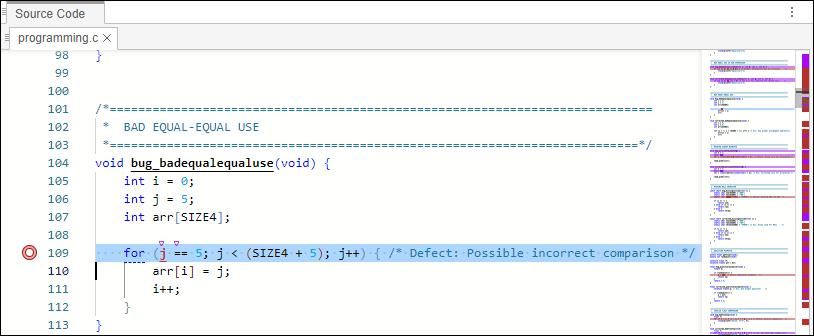
The Source Code pane shows the source code with the defects colored in red and the corresponding line number marked by ![]() .
.

Placing your cursor over a result displays a tooltip that provides range information for variables, operands, function parameters, and return values.
Examine Source Code
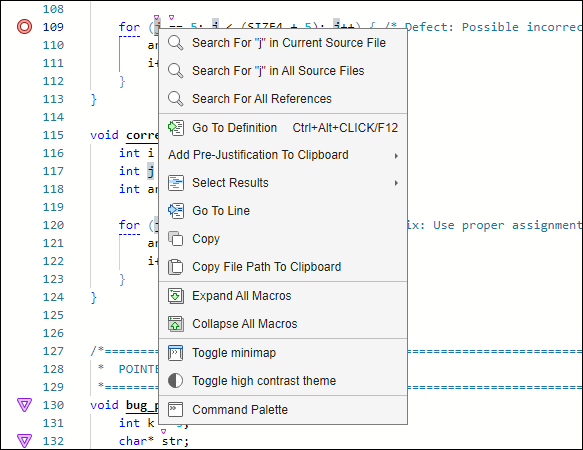
On the Source Code pane, if you right-click a text string, the context menu provides options to examine your code:

For example, if you right-click the variable j, you can use the following options to examine and navigate through your code:
Search For "j" in Current Source — List occurrences of the string within the current source file on the Code Search pane.
Search For "j" in All Source Files — List occurrences of the string within the source files on the Code Search pane.
Search For All References — List all references in the Code Search pane. The software supports this feature for global and local variables, functions, types, and classes.
Go To Definition — Go to the line of code that contains the definition of
j. The software supports this feature for global and local variables, functions, types, and classes. If a definition is not available to Polyspace®, selecting the option takes you to the declaration.Go To Cause — Selecting this option relocates the Source Code pane to the line of code Polyspace has identified as a probable cause of the defect.
Select Results — Open the Result Details pane for the selected result. If multiple results are at this location in the source code, you can choose to display every result at this location in the Results List pane.
Go To Line — Opens a text box where you can enter a line number to navigate to in the source code.
Expand All Macros or Collapse All Macros — Display or hide the content of macros in current source file.
Expand Macros
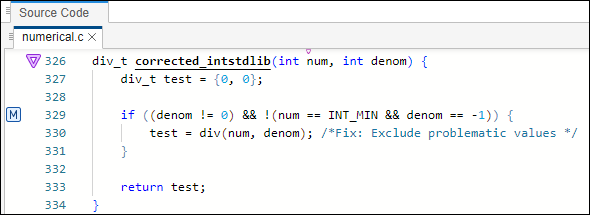
You can view the contents of source code macros in the source code view. A code information bar displays a macro icon ![]() to identify source code lines with macros.
to identify source code lines with macros.

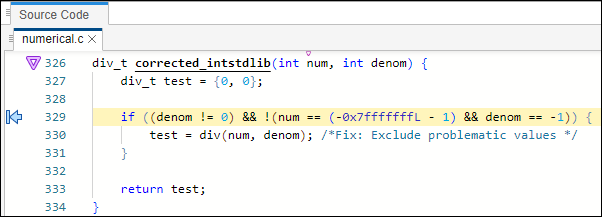
Select the icon to display the contents of macros on that line in a box.

To display the normal source code again, click the arrow icon that replaces the macro icon.
To display or hide the content of all macros:
Right-click anywhere on the source.
From the context menu, select either Expand All Macros or Collapse All Macros.
Note
The Result Details pane also allows you to view the contents of a macro if the check you select lies within a macro.
You cannot expand OSEK API macros in the Source pane.
Manage Multiple Files in Source Code Pane
You can view multiple source files in the Source pane.
Right-click on a file name in the Source Code pane toolbar. From the context menu, you can:
Close - Close the currently selected source file. You can also use the χ button to close tabs.
Close All Except <filename> - Close all source files except the currently selected file.
Close All - Close all source files.
Sub-Tile - Split the Source window vertically or horizontally to display the selected source file alongside another file. Select the option Single to revert the Source Code pane back to a one tile view.