Investigate Data Race Defects Using Data Race Graph in Polyspace Platform User Interface
This example shows how to leverage the Data Race Graph view when investigating a data race defect in the Polyspace Platform user interface.
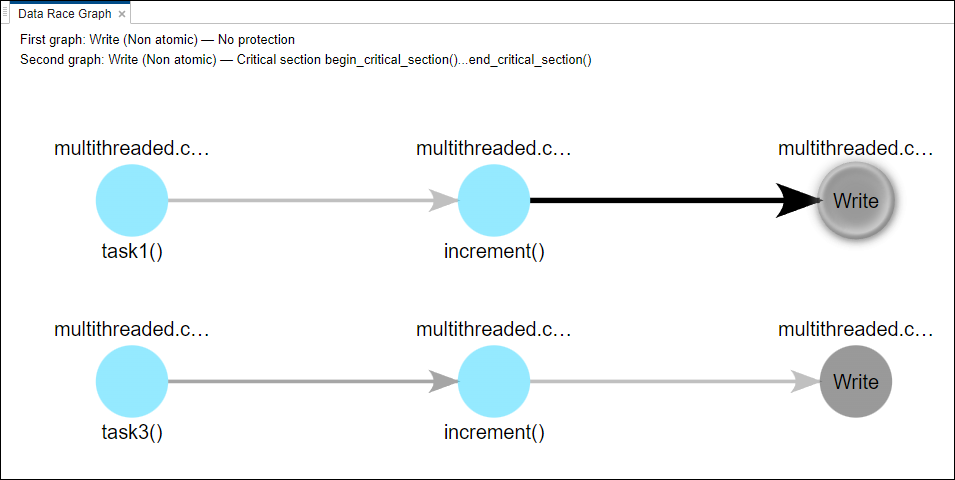
The Data Race Graph view displays the function call sequence of a data race defect starting from the entry point and progressing to the read or write operation or function call.
Click the ![]() icon next to a result in the Result
Details pane to open an individual graph for the result in the Data
Race Graph view.
icon next to a result in the Result
Details pane to open an individual graph for the result in the Data
Race Graph view.
You can:
View the function call and filename for each operation involved in the function sequence in order.
Click any node in the graph to see the corresponding operation in the Source Code pane.

In this example, you see two graphs:
The first graph that starts from
task1()shows a nonatomic write operation that does not have any protections.The second graph that starts from
task3()shows a nonatomic write operation in a critical section as defined by the code.
Both task1() and task3() call the function
increment() and perform conflicting operations on the same variable.
If you click on either Write node, the Source
Code pane updates to show the variable the code is performing a write action
on.
Once you understand why the data race defect is occurring, you can fix the defect. There are several different types of data race defects and fixes for them. In this example, one possible correction is to place the write operation in the critical section.
For more information on data race defects, enabling this defect during an analysis, and applying fixes, see the data race defect page relevant to your issue:
See Also
Data race | Data race through standard library function
call | Data race on
adjacent bit fields