具有可变数量参量的积分函数
此示例向您说明如何使用采用可变数量参量(而不是只采用一个参量)的 MATLAB® 函数创建 .NET 应用程序。
在此示例中,您执行以下步骤:
使用 MATLAB Compiler SDK™ 产品将 MATLAB 函数
drawgraph转换为 .NET 类 (Plotter) 的方法,并将该类包装在 .NET 程序集 (VarArgComp) 中。drawgraph函数显示输入参数的图,并作为Plotter类的方法调用。通过实例化
VarArgApp.cs类并使用VarArgApp.vb来表示数据,在 C# 应用程序 (Plotter) 或 Visual Basic® 应用程序 (MWArray) 中访问该组件。使用 Visual Studio® .NET 开发环境构建并运行
VarArgDemoApp应用程序。
文件
| MATLAB 函数 | drawgraph.mextractcoords.m |
| MATLAB 函数位置 | |
| C# 代码位置 | |
| Visual Basic 代码位置 | |
过程
将 MATLAB 产品附带的以下文件夹复制到您的工作文件夹:
matlabroot\toolbox\dotnetbuilder\Examples\VSVersion\NET\VarArgExample
在 MATLAB 命令提示符下,导航到工作文件夹中的新
VarArgExample\VarArgComp子文件夹。检查
drawgraph和extractcoords函数。function [xyCoords] = DrawGraph(colorSpec, varargin) numVarArgIn= length(varargin); xyCoords= zeros(numVarArgIn, 2); for idx = 1:numVarArgIn xCoord = varargin{idx}(1); yCoord = varargin{idx}(2); x(idx) = xCoord; y(idx) = yCoord; xyCoords(idx,1) = xCoord; xyCoords(idx,2) = yCoord; end xmin = min(0, min(x)); ymin = min(0, min(y)); axis([xmin fix(max(x))+3 ymin fix(max(y))+3]) plot(x, y, 'color', colorSpec);
function [varargout] = ExtractCoords(coords)

    for idx = 1:nargout
        varargout{idx}= coords(idx,:);
    end
使用以下信息,使用 .NET 程序集编译器或
compiler.build.dotNETAssembly构建 .NET 组件:字段 值 库名称 VarArgComp类名 Plotter要编译的文件 extractcoords.mdrawgraph.m例如,如果您使用的是
compiler.build.dotNETAssembly,请输入:buildResults = compiler.build.dotNETAssembly(["extractcoords.m","drawgraph.m"], ... 'AssemblyName','VarArgComp', ... 'ClassName','Plotter');
有关详细信息,请参阅生成 MWArray .NET 程序集并构建 .NET 应用程序中的说明。
确定是否使用 C# 还是 Visual Basic 来访问组件。
C#
如果您使用 C#,请为访问该组件的 C# 应用程序编写源代码。
此示例的示例应用程序位于
VarArgExample\VarArgCSApp\VarArgApp.cs中。以下语句是调用
drawgraph方法的替代方法:data= (MWNumericArray)plotter.drawgraph(colorSpec, coords[0], coords[1], coords[2],coords[3], coords[4]); ... data= (MWNumericArray)plotter.drawgraph((MWArray)colorSpec, coords);Visual Basic
如果您使用 Visual Basic,请为访问该组件的 Visual Basic 应用程序编写源代码。
此示例的示例应用程序位于
VarArgExample\VarArgVBApp\VarArgApp.vb中。以下语句是调用
drawgraph方法的替代方法:data = CType(plotter.drawgraph(colorSpec, coords(0), coords(1), coords(2), coords(3), coords(4)), MWNumericArray) ... data = CType(plotter.drawgraph(colorSpec, coords), MWNumericArray)
无论哪种情况,
VarArgApp程序都会执行以下操作:使用
colorSpec类库初始化三个数组(data、coords和MWArray)创建
Plotter对象调用
extracoords和drawgraph方法使用
MWNumericArray来表示方法所需的数据使用
try-catch模块捕获并处理任何异常
使用 Visual Studio 打开与您的应用程序语言相对应的 .NET 工程文件。
C#
如果您使用的是 C#,则
VarArgCSApp文件夹包含此示例的 Visual Studio .NET 工程文件。在 Windows® 资源管理器中双击VarArgCSApp.csproj在 Visual Studio .NET 中打开该工程。您也可以通过右键点击 VarArgCSApp.csproj 并选择在 MATLAB 外部打开从桌面打开它。Visual Basic
如果您使用的是 Visual Basic,则
VarArgVBApp文件夹包含此示例的 Visual Studio .NET 工程文件。在 Windows 资源管理器中双击VarArgVBApp.vbproj在 Visual Studio .NET 中打开该工程。您也可以通过右键点击 VarArgVBApp.vbproj 并选择在 MATLAB 外部打开从桌面打开它。
创建对位于生成或安装程序集的文件夹中的程序集文件
VarArgComp.dll引用。创建对
MWArrayAPI 的引用。如果您的系统上安装了 MATLAB matlabroot\toolbox\dotnetbuilder\bin\win64\<framework_version>\MWArray.dll如果您的系统上安装了 MATLAB Runtime <MATLAB_RUNTIME_INSTALL_DIR>\toolbox\dotnetbuilder\bin\win64\<framework_version>\MWArray.dll在 Visual Studio .NET 中构建并运行
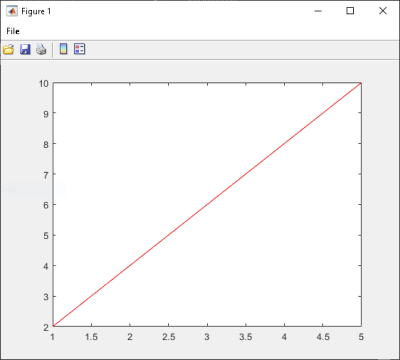
VarArgApp应用程序。该程序显示以下输出:
result=
     1     2
     2     4
     3     6
     4     8
     5    10