主要内容

本页采用了机器翻译。点击此处可查看英文原文。

在 .NET 程序集中使用多个类

R2026b

此示例向您说明如何创建使用多个类来分析信号并绘制结果图形的 .NET 程序集。

在此示例中,您执行以下步骤:

  • 使用 MATLAB® Compiler SDK™ 产品创建包含多个类的程序集 (SpectraComp)。

  • 在 C# 应用程序 (SpectraApp.cs) 或 Microsoft® Visual Basic® 应用程序 (SpectraApp.vb) 中访问该组件,包括使用 MWArray 类层次结构来表示数据。

  • 使用 Visual Studio® .NET 开发环境构建并运行应用程序。

SpectraComp 应用程序

SignalAnalyzer 类对输入数据数组执行快速傅里叶变换 (FFT)。此类的方法 computefft 将该 FFT 的结果作为两个输出数组返回 - 频率点数数组和功率谱密度。

第二个类 Plotter 使用 plotfft 方法绘制返回的数据。computefft 和 plotfft 这两个方法封装了 MATLAB 函数。computefft 计算输入数据的 FFT 和功率谱密度 computefft 并根据输入数据的长度和采样间隔计算频率点向量。plotfft 在 plotfft 图形窗口中绘制 MATLAB 数据和功率谱密度。

文件

MATLAB 函数computefft.m
plotfft.m
MATLAB 函数位置matlabroot\toolbox\dotnetbuilder\Examples\VSVersion\NET\SpectraExample\SpectraComp\
C# 代码位置matlabroot\toolbox\dotnetbuilder\Examples\VSVersion\NET\SpectraExample\SpectraCSApp\SpectraApp.cs
Visual Basic 代码位置matlabroot\toolbox\dotnetbuilder\Examples\VSVersion\NET\SpectraExample\SpectraVBApp\SpectraApp.vb

过程

  1. 将 MATLAB 产品附带的以下文件夹复制到您的工作文件夹:

    matlabroot\toolbox\dotnetbuilder\Examples\VSVersion\NET\SpectraExample
    

    在 MATLAB 命令提示符下,导航到工作文件夹中的新 SpectraExample\SpectraComp 子文件夹。

  2. 检查 MATLAB 函数 computefft.m 和 plotfft.m。

    function [fftData, freq, powerSpect] =
                       ComputeFFT(data, interval)
    if (isempty(data))
       fftdata = [];
       freq = [];
       powerspect = [];
       return;
    end
    if (interval <= 0)
       error('Sampling interval must be greater than zero');
       return;
    end
    fftData = fft(data);
    freq = (0:length(fftData)-1)/(length(fftData)*interval);
    powerSpect = abs(fftData)/(sqrt(length(fftData)));
    
    function PlotFFT(fftData, freq, powerSpect)
    
    len = length(fftData);
        if (len <= 0)
            return;
        end
        plot(freq(1:floor(len/2)), powerSpect(1:floor(len/2)))
        xlabel('Frequency (Hz)'), grid on
        title('Power spectral density')
    
  3. 使用 .NET 程序集编译器或 compiler.build.dotNETAssembly 构建 .NET 组件。

    将库命名为 SpectraComp。将名为 SignalAnalyzer 的类映射到函数 computefft.m,并将名为 Plotter 的第二个类映射到函数 plotfft.m。

    例如,如果您使用的是 compiler.build.dotNETAssembly,请输入:

    cmap = containers.Map;
    cmap('SignalAnalyzer') = 'computefft.m';
    cmap('Plotter') = 'plotfft';
    buildResults = compiler.build.dotNETAssembly(cmap, ...
    'AssemblyName','SpectraComp');

    有关详细信息,请参阅生成 MWArray .NET 程序集并构建 .NET 应用程序中的说明。

  4. 确定是否使用 C# 还是 Visual Basic 来访问组件。

    • C#

      如果您使用 C#,请为访问该组件的 C# 应用程序编写源代码。

      此示例的示例应用程序位于 SpectraExample\SpectraCSApp\SpectraApp.cs 中。

      using System;
      
      using MathWorks.MATLAB.NET.Utility;
      using MathWorks.MATLAB.NET.Arrays;
      
      using SpectraComp;
      
      namespace MathWorks.Examples.SpectraApp
      {
        /// <summary>
        /// This application computes and plots the power spectral density of an input signal. 
        /// </summary>
        class SpectraCSApp
          {
            #region MAIN
      
            /// <summary>
            /// The main entry point for the application.
            /// </summary>
            [STAThread]
            static void Main(string[] args)
              {
                try
                  {
                    const double interval= 0.01;  // The sampling interval
                    const int numSamples= 1001;   // The number of samples
      
                    // Construct input data as sin(2*PI*15*t) + (sin(2*PI*40*t)) plus a
                    // random signal.  Duration= 10; Sampling interval= 0.01
                    MWNumericArray data= new MWNumericArray(MWArrayComplexity.Real, 
                           MWNumericType.Double, numSamples);
      
                    Random random= new Random();
      
                    // Initialize data 
                    for (int idx= 1; idx <= numSamples; idx++)
                      {
                        double t= (idx-1)* interval;
      
                        data[idx]= Math.Sin(2.0*Math.PI*15.0*t) + Math.Sin(2.0*Math.PI*40.0*t) +
                             random.NextDouble();
                      }
      
                    // Create a new signal analyzer object
                    SignalAnalyzer signalAnalyzer= new SignalAnalyzer();
      
                    // Compute the fft and power spectral density for the data array
                    MWArray[] argsOut= signalAnalyzer.computefft(3, data, interval);
      
                    // Print the first twenty elements of each result array
                    int numElements= 20;
      			        
                    MWNumericArray resultArray= new MWNumericArray(MWArrayComplexity.Complex, 
                          MWNumericType.Double, numElements);
      
      			        for (int idx= 1; idx <= numElements; idx++)
      			          {
      				          resultArray[idx]= ((MWNumericArray)argsOut[0])[idx];
      			          }
      
      			        Console.WriteLine("FFT:\n{0}\n", resultArray);
      
                    for (int idx= 1; idx <= numElements; idx++)
                      {
                        resultArray[idx]= ((MWNumericArray)argsOut[1])[idx];
                      }
      
                    Console.WriteLine("Frequency:\n{0}\n", resultArray);
      
                    for (int idx= 1; idx <= numElements; idx++)
                      {
                        resultArray[idx]= ((MWNumericArray)argsOut[2])[idx];
                      }
      
                    Console.WriteLine("Power Spectral Density:\n{0}", resultArray);
      
                    // Create a new plotter object
                    Plotter plotter= new Plotter();
      
                    // Plot the fft and power spectral density for the data array
                    plotter.plotfft(argsOut[0], argsOut[1], argsOut[2]);
      
                    Console.ReadLine();  // Wait for user to exit application
                  }
      
                catch(Exception exception)
                  {
                    Console.WriteLine("Error: {0}", exception);
                  }
                }
      
              #endregion
          }
      }

      以下语句显示如何使用 MWArray 类库构造 MWNumericArray,用作 computefft 函数的方法输入。

      MWNumericArray data= new MWNumericArray(MWArrayComplexity.Real, 
      MWNumericType.Double, numSamples);

      以下语句创建 SignalAnalyzer 类的实例并调用方法 computefft,请求 3 个输出。

      SignalAnalyzer signalAnalyzer = new SignalAnalyzer(); 
      ...
      MWArray[] argsOut= signalAnalyzer.computefft(3, data, interval);
      
    • Visual Basic

      如果您使用 Visual Basic,请为访问该组件的 Visual Basic 应用程序编写源代码。

      此示例的示例应用程序位于 SpectraExample\SpectraVBApp\SpectraApp.vb 中。

      Imports System
      
      Imports MathWorks.MATLAB.NET.Utility
      Imports MathWorks.MATLAB.NET.Arrays
      
      Imports SpectraComp
      
      
      Namespace MathWorks.Examples.SpectraApp
      
          ' <summary>
          ' This application computes and plots the power spectral density of an input signal. 
          ' </summary>
          Class SpectraDemoApp
      
      #Region " MAIN "
      
              ' <summary>
              ' The main entry point for the application.
              ' </summary>
              Shared Sub Main(ByVal args() As String)
                  Try
                      Const interval As Double = 0.01   ' The sampling interval
                      Const numSamples As Integer = 1001   ' The number of samples
      
                      ' Construct input data as sin(2*PI*15*t) + (sin(2*PI*40*t)) plus a
                      ' random signal.  Duration= 10; Sampling interval= 0.01
                      Dim data As MWNumericArray = New MWNumericArray(MWArrayComplexity.Real, 
                                                   MWNumericType.Double, numSamples)
      
                      Dim random As Random = New Random
      
                      ' Initialize data 
                      Dim t As Double
                      Dim idx As Integer
                      For idx = 1 To numSamples
                          t = (idx - 1) * interval
                          data(idx) = New MWNumericArray(Math.Sin(2.0 * Math.PI * 15.0 * t) + 
                                          Math.Sin(2.0 * Math.PI * 40.0 * t) + 
                                          random.NextDouble())
                      Next idx
      
                      ' Create a new signal analyzer object
                      Dim signalAnalyzer As SignalAnalyzer = New SignalAnalyzer
      
                      ' Compute the fft and power spectral density for the data array
                      Dim argsOut() As MWArray = signalAnalyzer.computefft(3, data, 
                                                       MWArray.op_Implicit(interval))
      
                      ' Print the first twenty elements of each result array
                      Dim numElements As Integer = 20
                      Dim resultArray As MWNumericArray = 
                               New MWNumericArray(MWArrayComplexity.Complex, 
                                          MWNumericType.Double, numElements)
      
                      For idx = 1 To numElements
                          resultArray(idx) = (CType(argsOut(0), MWNumericArray))(idx)
                      Next idx
      
                      Console.WriteLine("FFT:{0}{1}{2}", Chr(10), resultArray, Chr(10))
      
                      For idx = 1 To numElements
                          resultArray(idx) = (CType(argsOut(1), MWNumericArray))(idx)
                      Next idx
      
                      Console.WriteLine("Frequency:{0}{1}{2}", Chr(10), resultArray, Chr(10))
      
                      For idx = 1 To numElements
                          resultArray(idx) = (CType(argsOut(2), MWNumericArray))(idx)
                      Next idx
      
                      Console.WriteLine("Power Spectral Density:{0}{1}{2}", 
                        Chr(10), resultArray, Chr(10))
      
                      ' Create a new plotter object
                      Dim plotter As Plotter = New Plotter
      
                      ' Plot the fft and power spectral density for the data array
                      plotter.plotfft(argsOut(0), argsOut(1), argsOut(2))
      
                      Console.ReadLine()  ' Wait for user to exit application
      
                  Catch exception As Exception
                      Console.WriteLine("Error: {0}", exception)
      
                  End Try
              End Sub
      #End Region
      
          End Class
      End Namespace
      

      下面的语句展示了如何使用 MWArray 类库构造必要的数据类型:

      Dim data As MWNumericArray = New MWNumericArray_
          (MWArrayComplexity.Real, MWNumericType.Double, numSamples)
      ...
      Dim resultArray As MWNumericArray = New MWNumericArray_
          (MWArrayComplexity.Complex, 
           MWNumericType.Double, numElements)
      

      以下语句创建 SignalAnalyzer 类的实例并调用方法 computefft,请求三个输出:

      Dim signalAnalyzer As SignalAnalyzer = New SignalAnalyzer
      ...
      Dim argsOut() As MWArray = 
          signalAnalyzer.computefft(3, data, 
              MWArray.op_Implicit(interval))

    无论哪种情况,SpectraApp 程序都会执行以下操作:

    • 构造一个输入数组,其值表示一个随机信号,其中包含两个频率分别为 15 Hz 和 40 Hz 的正弦波

    • 创建包含数据的 MWNumericArray 数组

    • 实例化 SignalAnalyzer 对象

    • 调用 computefft 方法,计算 FFT、频率和谱密度

    • 实例化 Plotter 对象

    • 调用 plotfft 方法,绘制数据

    • 使用 try / catch 模块来处理异常

  5. 使用 Visual Studio 打开与您的应用程序语言相对应的 .NET 工程文件。

    • C#

      如果您使用的是 C#,则 SpectraCSApp 文件夹包含此示例的 Visual Studio .NET 工程文件。在 Windows® 资源管理器中双击 SpectraCSApp.csproj 在 Visual Studio .NET 中打开该工程。您也可以通过右键点击 SpectraCSApp.csproj 并选择在 MATLAB 外部打开从桌面打开它。

    • Visual Basic

      如果您使用的是 Visual Basic,则 SpectraVBApp 文件夹包含此示例的 Visual Studio .NET 工程文件。在 Windows 资源管理器中双击 SpectraVBApp.vbproj 在 Visual Studio .NET 中打开该工程。您也可以通过右键点击 SpectraVBApp.vbproj 并选择在 MATLAB 外部打开从桌面打开它。

  6. 添加对您的程序集文件 SpectraComp.dll 的引用。

  7. 添加对 MWArray API 的引用。

    如果您的系统上安装了 MATLABmatlabroot\toolbox\dotnetbuilder\bin\win64\<framework_version>\MWArray.dll
    如果您的系统上安装了 MATLAB Runtime<MATLAB_RUNTIME_INSTALL_DIR>\toolbox\dotnetbuilder\bin\win64\<framework_version>\MWArray.dll

  8. 在 Visual Studio .NET 中构建并运行 SpectraApp 应用程序。

    该程序显示以下输出:

    FFT:
       1.0e+02 *
    
       4.8646 + 0.0000i
      -0.0289 + 0.1080i
      -0.0326 + 0.0237i
      -0.0141 - 0.0148i
       0.0674 - 0.0487i
       0.0753 + 0.0669i
       0.0275 - 0.0101i
      -0.0429 + 0.0472i
       0.0803 - 0.1163i
      -0.0619 - 0.1072i
       0.0565 - 0.0502i
      -0.0223 + 0.0587i
      -0.0853 - 0.0812i
      -0.0662 - 0.0143i
       0.0543 - 0.0972i
       0.0814 - 0.0463i
      -0.0981 - 0.0190i
       0.0042 + 0.0083i
      -0.0339 + 0.0290i
       0.0291 + 0.0036i
    
    Frequency:
       0.0000 + 0.0000i
       0.0999 + 0.0000i
       0.1998 + 0.0000i
       0.2997 + 0.0000i
       0.3996 + 0.0000i
       0.4995 + 0.0000i
       0.5994 + 0.0000i
       0.6993 + 0.0000i
       0.7992 + 0.0000i
       0.8991 + 0.0000i
       0.9990 + 0.0000i
       1.0989 + 0.0000i
       1.1988 + 0.0000i
       1.2987 + 0.0000i
       1.3986 + 0.0000i
       1.4985 + 0.0000i
       1.5984 + 0.0000i
       1.6983 + 0.0000i
       1.7982 + 0.0000i
       1.8981 + 0.0000i
    
    Power Spectral Density:
      15.3755 + 0.0000i
       0.3534 + 0.0000i
       0.1274 + 0.0000i
       0.0646 + 0.0000i
       0.2628 + 0.0000i
       0.3183 + 0.0000i
       0.0925 + 0.0000i
       0.2016 + 0.0000i
       0.4465 + 0.0000i
       0.3912 + 0.0000i
       0.2387 + 0.0000i
       0.1985 + 0.0000i
       0.3723 + 0.0000i
       0.2140 + 0.0000i
       0.3520 + 0.0000i
       0.2960 + 0.0000i
       0.3158 + 0.0000i
       0.0294 + 0.0000i
       0.1411 + 0.0000i
       0.0927 + 0.0000i
    
    Plotting Power spectral density, please wait...
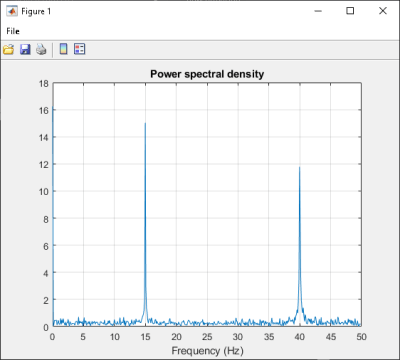
    A figure that displays a plot of the power spectral density.

另请参阅

主题