构造二维和三维样条曲线
此示例说明如何使用 Curve Fitting Toolbox™ 中的 cscvn 命令来构造二维和三维三次样条曲线。
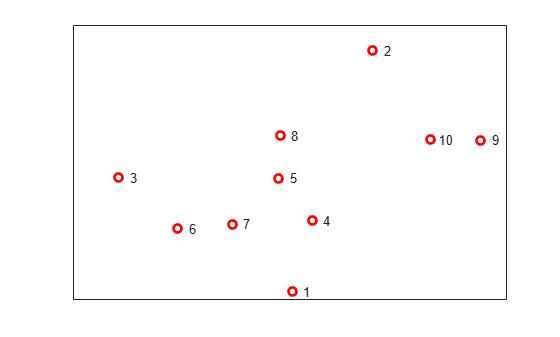
选择点
此示例说明如何按照一系列点各自的出现顺序绘制一条经过这些点的平滑曲线。首先,我们在平面中选择一些随机点,并将它们存储在矩阵中,每列一个点。
npts = 10;
xy = [randn(1,npts); randn(1,npts)];
plot(xy(1,:),xy(2,:),'ro','LineWidth',2);
text(xy(1,:), xy(2,:),[repmat('  ',npts,1), num2str((1:npts)')])
ax = gca;
ax.XTick = [];
ax.YTick = [];
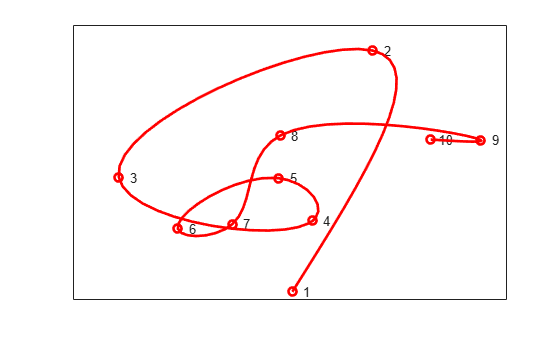
连接这些点
接下来,使用 cscvn 命令构造曲线,并使用 fnplt 绘制曲线。
hold on
fnplt(cscvn(xy),'r',2)
hold off
如果您要以交互方式输入这一系列点,也可以使用 getcurve 命令。
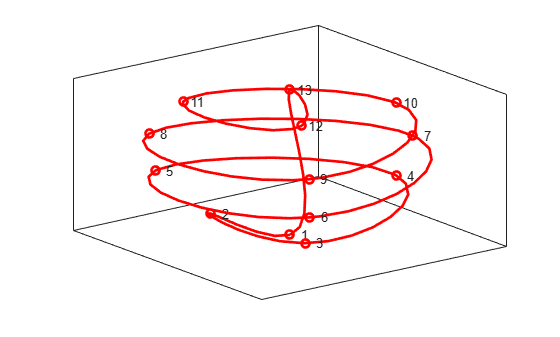
三维样条曲线
创建三维样条曲线也同样简单。这一次,我们不完全随机选择点。首先,我们来生成一些点。
npts = 13;
t = linspace(0,8*pi,npts);
z = linspace(-1,1,npts);
omz = sqrt(1-z.^2);
xyz = [cos(t).*omz; sin(t).*omz; z];
plot3(xyz(1,:),xyz(2,:),xyz(3,:),'ro','LineWidth',2);
text(xyz(1,:),xyz(2,:),xyz(3,:),[repmat('  ',npts,1), num2str((1:npts)')])
ax = gca;
ax.XTick = [];
ax.YTick = [];
ax.ZTick = [];
box on
连接这些点
下面是使用 cscvn 构造的经过这些点的三维样条曲线。通过将第一个点追加到列表的末尾,我们得到一条平滑的闭合曲线。
hold on
fnplt(cscvn(xyz(:,[1:end 1])),'r',2)
hold off