Execution Time Profiling of Field-Oriented Control (FOC) Algorithm Using PIL on Renesas RA Microcontrollers
This example shows how to use the Embedded Coder® Support Package for Renesas® RA Microcontrollers to perform Processor-in-the-Loop (PIL) profiling of a Field-Oriented Control (FOC) motor control algorithm on the Renesas MCK-RA6T2 hardware board. In PIL simulation, the control algorithm executes on the target hardware while the plant model runs on the host machine. This configuration enables you to measure and compare execution times, as well as verify numerical equivalence between simulation and hardware implementations.
This example illustrates code verification and profiling for key control algorithms. In this workflow, you will:
Verify code execution on the target hardware using PIL testing.
Measure algorithm execution time and generate a comprehensive PIL profiling report.
Perform stack profiling and generate a detailed stack usage report.
This process leverages both the SIL/PIL Manager and command-line tools. Results are automatically transferred back to Simulink, allowing you to confirm that the deployed code matches the original model design.
For more information, see Choose a SIL or PIL Approach and SIL/PIL Manager.
Prerequisites
Complete Hardware Setup for Embedded Coder Support Package for Renesas RA Microcontrollers.
Go through SIL/PIL Manager documentation.
Familiarize with Test Generated Code with PIL Simulations on Renesas RA Microcontrollers for Renesas RA.
Required Hardware
Renesas RA6T2 based board (RA6T2 MCK).
USB type C cable.
FTDI Friend. This example uses FTDI Friend USB TTL-232R 3.3V adapter.
USB TTL-232R 3.3V adapter.
Hardware Connection
When using an FTDI adapter for communication between the host computer and the Renesas RA6T2 target board, make the following connections.
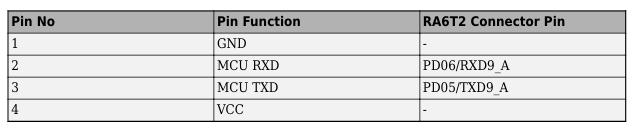
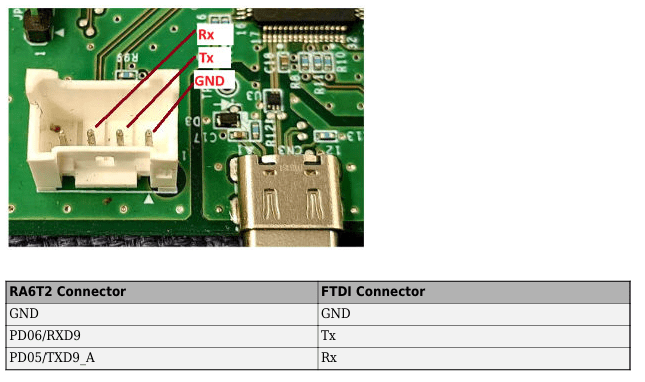
The Rx, Tx, and GND labels shown in red in the figure indicate the corresponding pins on the FTDI connector.
Configure PIL Model
1. Open example models.
Open the
renesas_pmsm_foc_sim.slxmodel. This model simulates the PMSM motor and the FOC algorithm for closed-loop speed control.
modelName = 'renesas_pmsm_foc_sim.slx';
open_system(modelName)
Open the
CurrentControl_ModelRef.slxmodel. This model implements the Current Control algorithm for closed-loop operation of PMSM.
modelName = "CurrentControl_ModelRef.slx";
open_system(modelName)
2. Configure hardware settings.
In the
CurrentControl_ModelRef.slxmodel, click Modeling > Model Settings to open the Configuration Parameters dialog.In the Configuration Parameters dialog box, navigate to Hardware Implementation > Hardware board and select
Renesas RA6 Basedboard.Navigate to Target hardware resources > Build options. Click Create to create a Renesas Smart Configurator xml and provide a name for the project. For example,
pmsmConfigurationXml. This creates a Renesas Smart Configurator project that has recommended settings for USART name, channel, baud rate, and so on.
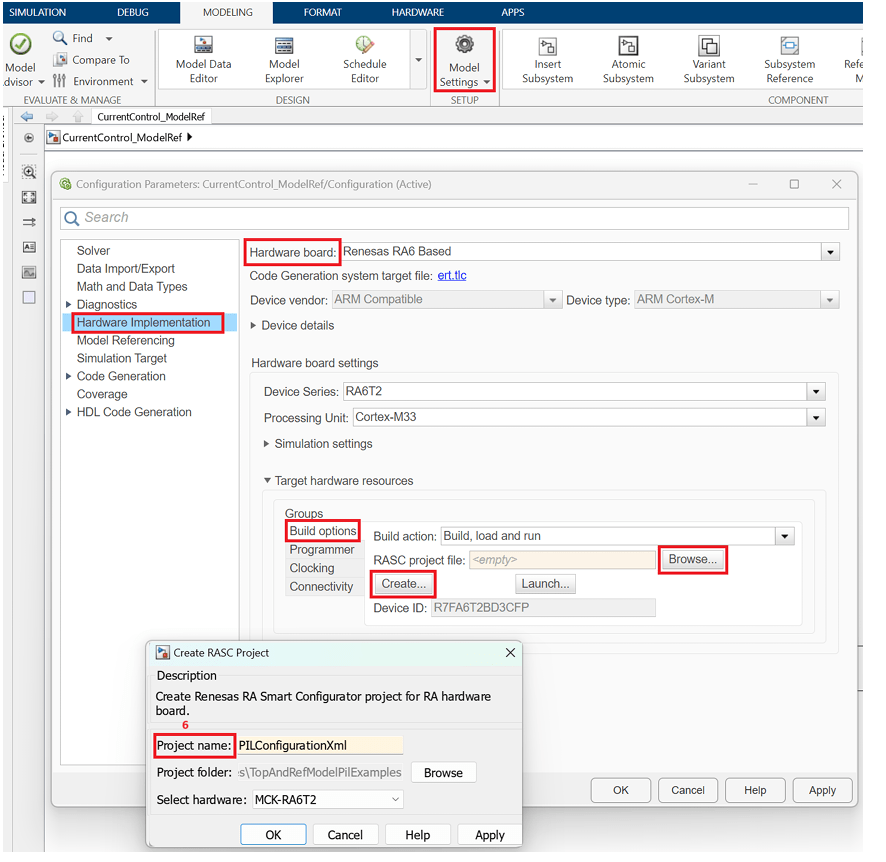
To select an existing configuration.xml file, click Browse.
3. Set up SIL/PIL Manager.
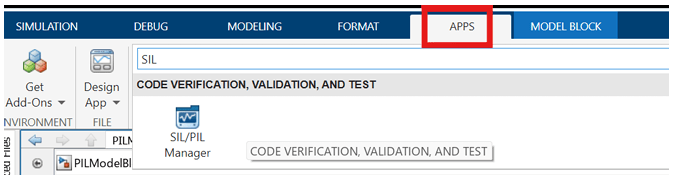
In the Simulink toolstrip of
renesas_pmsm_foc_sim.slxmodel, click Apps and then select SIL/PIL Manager.
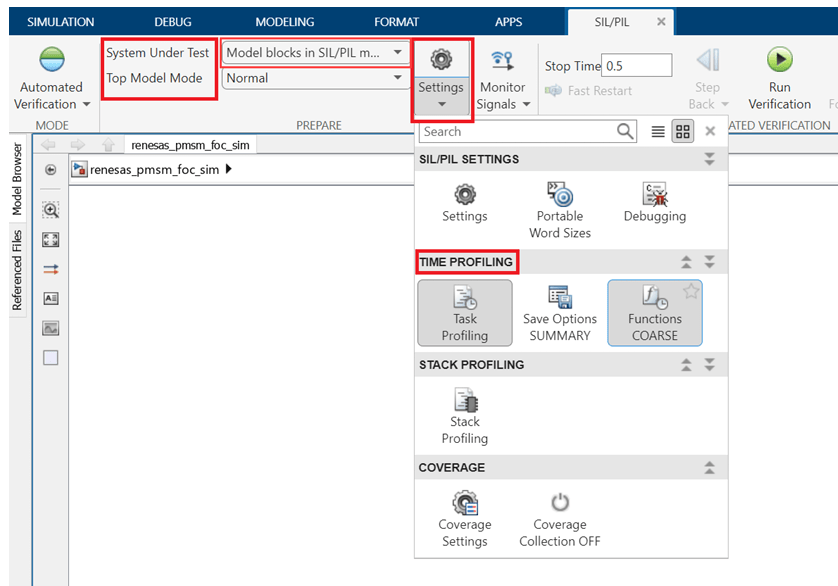
In the System Under Test section, select Model blocks in SIL/PIL mode.
In the Connectivity tab, enter the COM Port number on which the FTDI is connected. You can find this COM port number in the Device Manager.
4. Configure Profiling Options: In the Time Profiling options, enable the task profiling options as needed. In this example, set the Summary Options to Summary Only and Functions Coarse.
5. Run SIL/PIL Simulation: Click Run SIL/PIL from the SIL/PIL tab to run the normal and PIL simulation.
Note: PIL simulation takes longer than the host-machine-based simulation. This is because of the serial communication (inputs and outputs of the Current Control (PIL) subsystem) between the host machine and subsystem that runs on the target hardware.
Analyze Results
Verify Numerical Equivalence
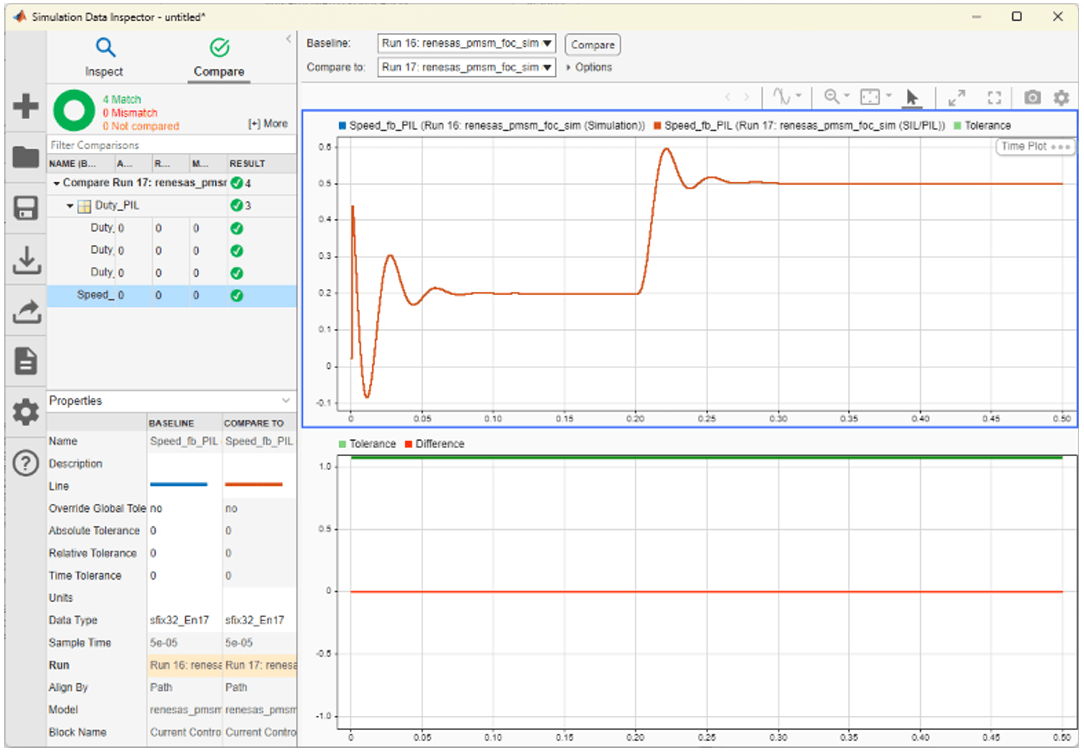
After the simulation, click Compare Runs from the SIL/PIL tab.
Compare the signals logged during host-machine-based simulation and PIL simulation (executed on the target hardware). This comparison helps verify the accuracy of host-machine-based simulation and PIL simulation results. This plot compares the speed feedback signals from the Current Control (PIL) and Current Control (normal simulation)
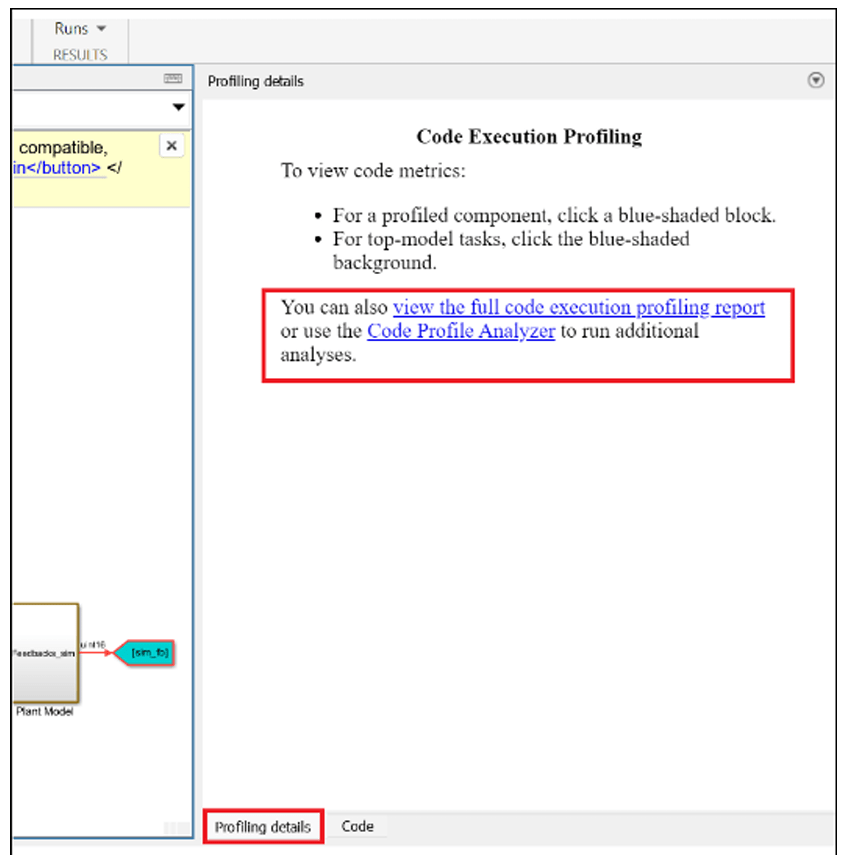
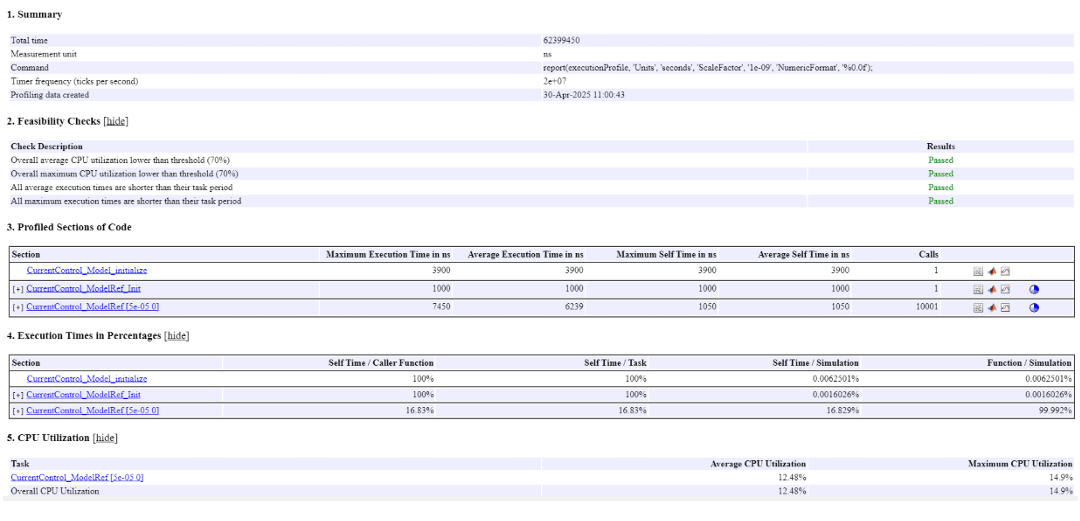
Review Task Profiling Report
When PIL simulation ends, a task profiling report is generated. You can also access this report from the bottom right corner of the model, as shown in this image
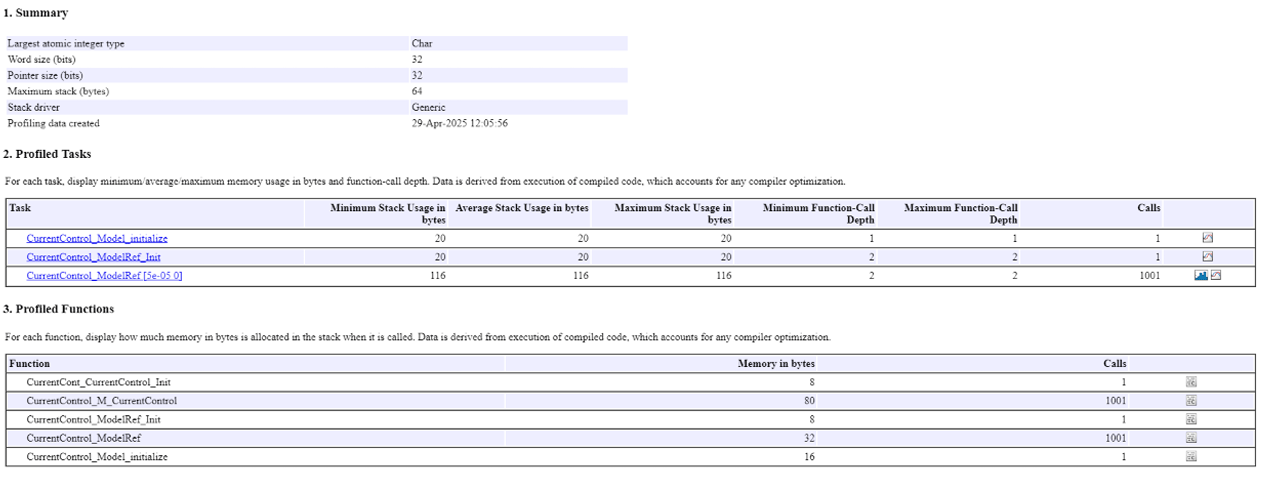
Perform Stack Profiling
To analyze stack usage:
Disable task profiling and enable stack profiling in the configuration options.
Rerun run the PIL Simulation.
On completion, a stack profiling report will be generated. Review the report to ensure stack usage is within hardware limits.