Fast Serial Data Monitoring on STM32 Boards Using a Two-Model Approach
This example shows how to implement fast serial data monitoring on STM32 boards using a two-model approach . This approach, as explained in this example, involves a target model deployed on the STM32 hardware board and a host model running on the host computer with Embedded Coder® Support Package for STMicroelectronics® STM32 Processors installed.
Two-Model Approach
The Monitor & Tune feature (also called External mode) in the support package has limitations when it comes to fast data logging, particularly for sample times below 30 microseconds, even at high baud rate. The two-model approach in Simulink® provides an effective method for fast serial data monitoring, overcoming the limitations of External mode. By separating data acquisition and processing between the target and host models, this approach allows for efficient real-time data logging and visualization.
This table shows a comparison of lowest possible sample time with the different methods for data monitoring with STM32 hardware.
Data Monitoring Method | Lowest possible sample time for monitoring of one signal of |
Monitor & Tune (External mode) feature | 30μs (baud rate: 7.5 Mbps) |
Two-model approach | 7.5μs (baud rate: 7.5 Mbps) |
This graph shows the transmission of data from the target model to host model for a sample time of 50μs. Here the data logging logic is designed by considering Data A and Data B being signals of same data type. Header and Terminator are additional mandatory inputs to the data logging logic.

The target model is responsible for acquiring and transmitting data from the STM32 hardware board. In addition to data acquisition blocks (which interfaces with hardware sensors or data sources), the target model also includes serial data transmit blocks that send data to the host model.
The host model handles data reception from the target hardware using serial data receive blocks. You can use the data visualization methods in Simulink to monitor the data.
Target Model for Synchronous Data Logging
Synchronous data logging involves predefined sample times. Ensure that all signals have same sample times.
This example includes a sample target model that you can use for synchronous data logging - stm32g4xx_synchronous_logging_target.slx.

This is a multi-signal model that uses a Mux block, with all the signals being single data type, and the data being acquired using the same sample time (50μs). The Data Logging subsystem contains the logic to create data frames along with header and terminator, which will be sent to host model. The Serial Transmit subsystem in the model consists of a While Iterator Subsystem, which in-turn includes a UART/USART Write block that is configured to send serial data via LPUART1 module.
When logging multiple signals, the sample time is divided among the signals. For instance, if logging two signals with a sample time of 30 microseconds, each signal effectively gets a sample time of 15 microseconds. Ensure that all signals are converted to a uniform data type.
Additional Considerations
Because the signal datatype is single, one single data (4 bytes) is sent at each time-step (except for the first and last sample of the packet where the header/footer is sent along with the data). In this scenario, selecting Polling mode (under the Transmit mode option) ensures lesser time for data transfer than the interrupt mode (which triggers an interrupt after every byte) or even the DMA mode.

To improve performance and reduce overruns, it is also recommended that you enable FIFO mode in the STM32CubeMX, as shown in the below image.

Target Model for Asynchronous Data Logging
For the target model that handles asynchronous data, ensure that interrupts occur at regular intervals. Use hardware interrupt blocks to trigger logging.
This example includes a sample target model that you can use for asynchronous data logging - stm32g4xx_asynchronous_logging_target.slx.

In this model, the timer generates an update interrupt at a known, configured interval. The Function-Call Subsystem in the model contains the Data Logging subsystem that is similar to the synchronous data logging model. The Serial Transmit subsystem in the Function-Call Subsystem consists of a While Iterator Subsystem, which in-turn includes a UART/USART Write block that is configured to send serial data via LPUART1 module.
Host Model for Data Monitoring
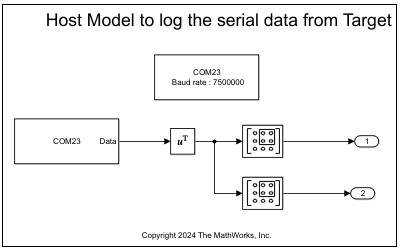
This example includes a sample host model, stm32_fast_serial_datalogging_host.slx, which you can use for receiving serial data from multiple signals (of same data type) and perform data monitoring. The model consists of Serial Configuration and Serial Receive blocks, and also two Submatrix blocks. In the Serial Receive block, you also define the Header and Terminator to be the same as the signal received from target model.

Note: To monitor both synchronous and asynchronous data from the target model at the same time, use separate serial ports to receive data.
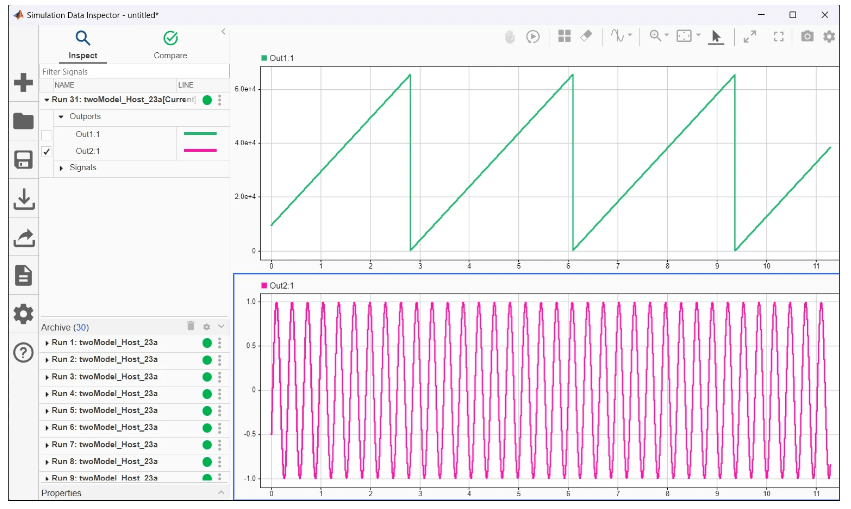
Without the DSP System Toolbox™, real-time plotting is limited. Data must be logged and then viewed using the Simulink Data Inspector after simulation. This image shows an instance on multi-signal logging as seen in the Simulink Data Inspector.

This design of the host model results in faster simulation. Even when you are logging a 10μs signal with a 3000x1 data packet, close to real-time speeds can be achieved.
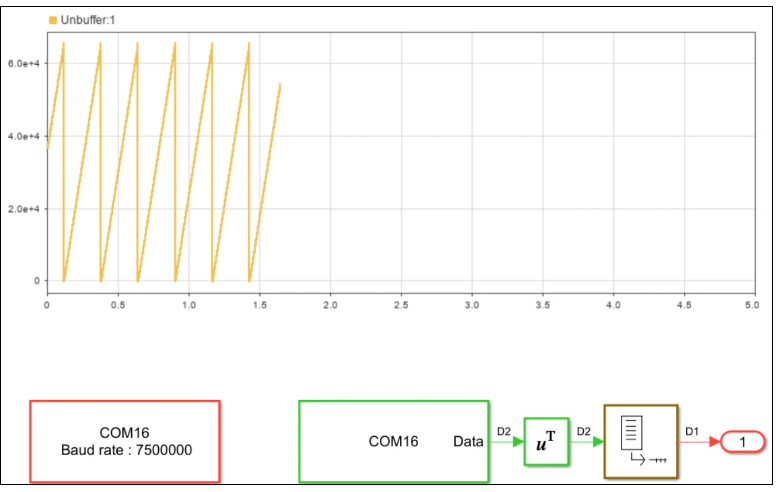
To perform real-time plotting within Simulink, you can use the Unbuffer (DSP System Toolbox) block in the host model. This figure shows the monitoring of a signal using an Unbuffer block connected to the output of the Transpose block.

This approach allows you to view the data from target model in real-time using a Dashboard Scope block.
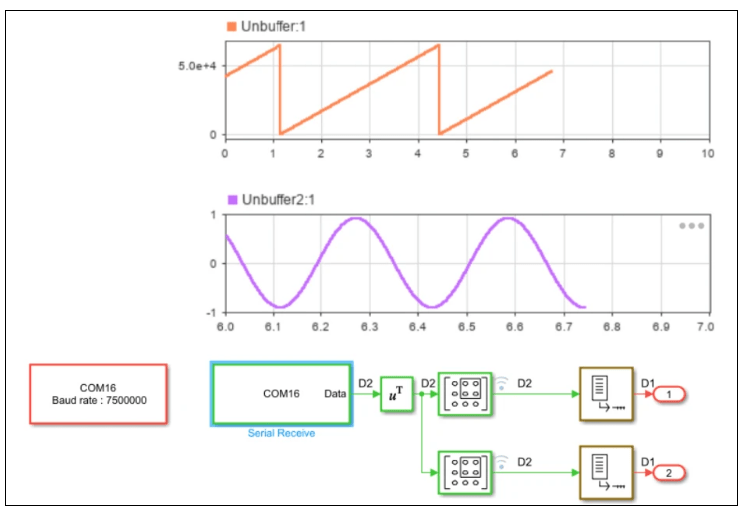
The below image shows two Unbuffer blocks being used to monitor the data in real-time.

Note: Using Unbuffer block to view data in real-time may introduce some latency, especially with large data sizes.
This table shows few benchmarks that you can consider to decide on the minimum sample time of the data, if the Serial Receive block in the host model use Block sample time of 0.03 (30ms).
Data Type | Max Packet Size | Minimum sample time (μs) for data logging | Example header and footer |
uint32/single | 4000x1 | 7.5 | Header: typecast(uint8('SSss'),'single')Footer: typecast(uint8('eeEE'),'single') |
uint16 | 5000x1 | 6 | Header: typecast(uint8('SS'),'uint16')Footer: typecast(uint8('ee'),'uint16') |
uint8 | 6000x1 | 5 | Header: typecast(uint8('S'),'uint8')Footer: typecast(uint8('e'),'uint8') |
Note: If multiple signals need to be logged, the packet size must be accordingly distributed among all logged signals. For example, if 4 signals of single datatype need to be logged, the maximum packet size is 1500x4 and each signal can have a minimum sampling time of 20μs.
Note: The ideal sampling time of signal to achieve real-time plotting (single-signal logging) is 50 μs with packet size of 600x1, resulting in a data packet every 0.03ms.
Limitations
When a model has synchronous and asynchronous data, you must use separate serial ports for each type of data.
The host model can reliably plot data in real-time when the Serial Receive block has a sampling time of 30ms. Therefore, the data packet size must be chosen appropriately. Data packet size greater than 3000 does not work.
Signals with different datatypes cannot be logged together. They need to be converted to the same datatype before being muxed together.