Tips and Limitations
Triggered Model Block
Consider the case where a triggered Model block is configured to run in the SIL or PIL simulation mode. The software generates one execution-time measurement each time the referenced model is triggered to run. If there are multiple triggers in a single time step, the software generates multiple measurements for the triggered Model block. Conversely, if there is no trigger in a given time step, the software generates no time measurements.
Outliers in Execution-Time Profiles
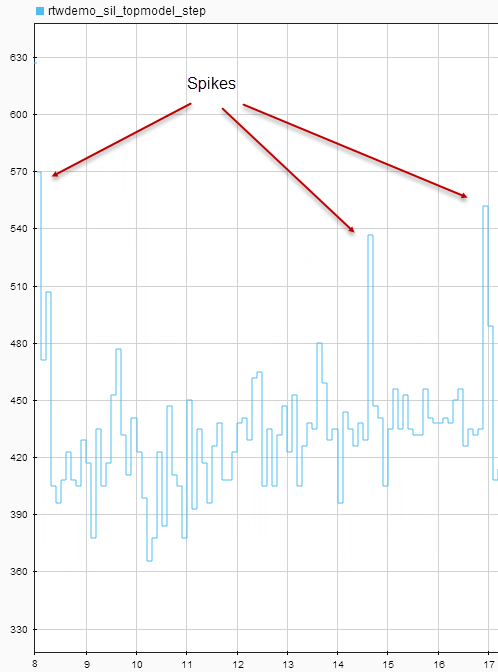
When you run a SIL simulation with execution time profiling enabled, you might see spikes in execution-time measurements.

The spikes are due to process preemption that occurs with a multitasking host operating system. If the operating system preempts the SIL process and runs another process, the measured execution time includes the time during which the SIL process is suspended. With a PIL simulation, you do not see spikes because code execution on the target is not preempted.
Counter wrapping produces execution-time measurements that are smaller than expected. For SIL, the counter wraps when an execution-time period is greater than 264 ticks. For PIL, the wrapping point depends on the timer you specify and can be 28, 216, 232, or 264 ticks.
Consider a PIL example where the timer frequency is 20 MHz. For a 32-bit timer, wrapping
occurs when the execution-time period is greater than 1/(20e6)*(2^32-1),
that is, 214.7 s. However, for a 16-bit timer, the point at which wrapping occurs is 0.0033
s.
For a real-time, multi-core application, the software accommodates synchronization discrepancies when recording timer values for different cores, which effectively reduces the timer measurement range.
Zero Values in Code Execution Profiling Report
The sensitivity of timers on a macOS Apple silicon computer is not as high as that for timers on a Windows, Linux, or macOS Intel® computer. For short functions in generated code, you might observe more zeroes in the code execution profiling reports produced by host-based XCP external mode or SIL simulations on a macOS Apple silicon computer.
Hardware-Specific Timer
If your target configuration does not already specify a timer, create a timer object that provides details of the hardware-specific timer and associated source files:
For SIL simulation, the timer word length is 64 bits.
For PIL simulation, specify an unsigned 8-, 16-, 32-, or 64-bit timer. For more information, see Specify Hardware Timer for Simulink.
Effect of Instrumentation Code on Instruction Cycle
Instrumentation code increases the volume of code to run and can result in the CPU requiring more cycles to fetch code blocks from memory. This is one of the effects of instrumentation code on the fetch stage and depends on how the code is aligned in memory. If the instrumented code does not fit in the same number of blocks as code that is not instrumented, the prefetch unit must transfer more blocks.
Task Context Switching Due to Preemption
Profiling instrumentation is intrusive and affects the quantity that it is meant to measure. Therefore, the design goal is to maximize code understanding with a minimum of instrumentation. For example, with a real-time system, there can be task context switches due to preemption. These context switches are not explicitly instrumented. To record the start and end of each task, the software must infer context switches from instrumentation. As a result, the software reports behavior that is an estimate. The estimate is subject to error because of incomplete instrumentation within the kernel.
In some cases, when the software cannot accurately determine behavior, the software generates a warning:
Warning: Unable to analyze n profiling data points. ...
Not all mutex take system calls (associated with rate transitions) are instrumented. In the case of Simulink® Real-Time™, this situation might arise if you generate code for a model reference hierarchy without enabling function profiling for all referenced models. If a mutex take system call is not instrumented, a task context switch might occur that is not visible to the execution profiling analysis. For better detection of preemption, enable function profiling:
set_param(model, ...
          'CodeProfilingInstrumentation', 'detailed');
The target hardware is overloaded and tasks overrun. Profiling samples from different task executions interleave and the software is unable to infer the correct sequence. To address the issue, reduce the instrumentation overhead for tasks by disabling function profiling:
set_param(model, ...
          'CodeProfilingInstrumentation', 'off');
In other cases, although the software cannot accurately determine behavior, the software does not generate a warning.
Subsystem Code Reuse
You cannot generate execution-time profiles for function call sites within subsystem code that is reused across a model or multiple models. For information about subsystem code reuse, see Generate Reusable Code from Library Subsystems Shared Across Models.
Cannot Load Execution-Time Measurements from Previous Release
You cannot load execution-time measurements saved with a previous release. For example, using R2014a, you save workspace variables to a MAT-file. One of the workspace variables contains execution-time measurements. In R2015b, if you try to load the MAT-file, you see this error:
Format of execution profiling data is invalid. This error can occur if
you load data from a previous release. Loading data from a previous
release is not supported.