Real-Time Code Execution Profiling
This example shows how to profile the real-time execution of generated code running as an executable on the ARM® processor on an AMD Zynq® board.
Introduction
Sample times specified in a Simulink® model determine the time schedule for running generated code on target hardware. With sufficient computing power on the hardware, the code runs in real-time according to the specified sample times. With real time execution profiling, you can check if the generated code meets your real-time performance requirements. Profiling also enables analysis of how your application uses different cores on multicore architectures. Using the information from profiling, you can adjust your design to either meet the real-time requirements or improve the use of available hardware resources.
This example shows a workflow to:
Configure a model to code generation and execution profiling.
Deploy generated code as an executable to the ARM processor on an AMD Zynq board.
Analyze performance through profiling plots and reports.
Requirements
Profile Task Execution
This section shows how to configure a model to profile the execution of two different tasks representing two different algorithms.
1. Open the zynq_profiling model.

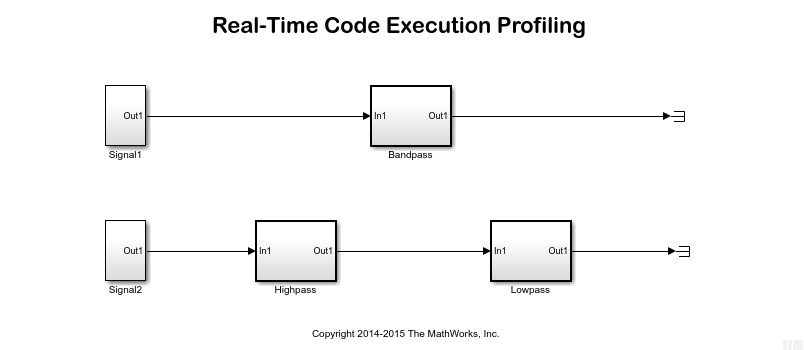
The Signal1 and Bandpass subsystem blocks define the first algorithm in the model. The Signal1 block produces a 760 Hz sine waveform with additive Gaussian noise. To extract the sine wave component, the Bandpass block uses a bandpass FIR filter with sample time of 1/3800 and frame size of 76. The Signal2, Highpass, and Lowpass subsystem blocks define the second algorithm in the model. The Signal2 block produces a 1266 Hz sine waveform with additive Gaussian noise. To extract the sine wave component, the Highpass and Lowpass blocks use a highpass and lowpass FIR filters, respectively, with sample times of 1/19,000 and frame size of 760.
2. On the Hardware tab of the Simulink Toolstrip, click Hardware Settings. In the Configuration Parameters dialog box, select Code Generation > Verification.
3. Select Code profiling > Measure task execution time to profile execution time for each rate in the model. The Workspace variable value, executionProfile, holds the profiling data in the workspace. Click OK.
4. On the Hardware tab of the Simulink Toolstrip, click Monitor & Tune to build, deploy, and run your model as an executable on the ARM Cortex-A processor. At the start of execution, a window appears and shows that the executable is running on the AMD Zynq board. The code runs for 5 seconds and then stops.
6. At the MATLAB® command prompt, enter this code to get the profiling data into the MATLAB workspace.
codertarget.profile.getData('zynq_profiling')
7. Enter this code to obtain the profiling report for the session that you just ran. The report shows each task has a different expected turnaround and execution time. Close the report.
executionProfile.report
8. Enter this code to visualize the scheduling of two different tasks. The faster task preempts the slower task, and the slower task finishes before it is scheduled to run again.
executionProfile.schedule
Profile Function Execution
This section shows how to configure the model for profiling the execution of different functions in your model. Function execution profiling gives more insight into the behavior of generated code by profiling each function and overall tasks for each sample rate.
1. Open the zynq_profiling model.
2. On the Hardware tab of the Simulink Toolstrip, click Hardware Settings. In the Configuration Parameters window, select Code Generation > Verification.
3. Select Code profiling > Measure task execution time to profile execution time for each rate in the model. Set Measure function execution times to Detailed (all function call sites). This setting enables the profiling execution time for each rate and each function in the generated code. Click OK.
4. On the Hardware tab of the Simulink Toolstrip, click Monitor & Tune to build, deploy, and run your model as an executable on the ARM Cortex-A processor. At the start of execution, a window appears and shows the executable is running on the AMD Zynq board. The code runs for 5 second and then stops.
5. At the MATLAB command prompt, enter this code to get the profiling data into the MATLAB workspace.
codertarget.profile.getData('zynq_profiling')
6. Enter this code to obtain the profiling report for the session that you just ran. The report shows each task and function has a different turnaround and execution time. Close the report.
executionProfile.report
7. Enter this code to visualize the scheduling of the two different tasks and functions.
executionProfile.schedule
Profile Concurrent Task Execution
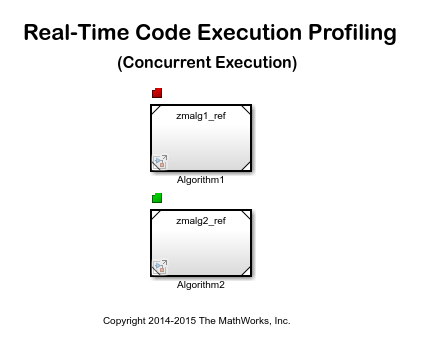
This section shows how to profile generated code for a model configured for concurrent task execution. Since the AMD Zynq ARM Cortex-A has two processor cores, you get the information on the core usage as well as the task information. The model is already configured for concurrent execution.
1. Open the zynq_profiling_concurrent model.

2. On the Hardware tab of the Simulink Toolstrip, click Hardware Settings. In the Configuration Parameters window, select Code Generation > Verification.
3. Select Code profiling > Measure task execution time to profile execution time for each rate in the model. The Workspace variable value, executionProfile, holds the profiling data in the workspace. Click OK.
4. On the Hardware tab of the Simulink Toolstrip, click Monitor & Tune to build, deploy, and run your model as an executable on the ARM Cortex-A9 processor. At the start of execution, a window appears and shows the executable is running on the Zynq hardware. The code runs for 5 second and then stops.
5. At the MATLAB command prompt, enter this code to get the profiling data into the MATLAB workspace.
codertarget.profile.getData('zynq_profiling_concurrent')
6. Enter this code to obtain the profiling report for the session that you just ran. The report shows each task and function has a different turnaround and execution time. Close the report.
executionProfile.report
7. Enter this code to visualize the scheduling of two different tasks. Each task executes on a separate core.
executionProfile.schedule
Other Things to Try
Profile the sample models from other Embedded Coder® Support Package for AMD SoC Devices examples.