Propose Data Types for Merged Simulation Ranges
This example shows how to use the Fixed-Point Tool to propose fraction
lengths for a model based on the minimum and maximum values captured over multiple
simulations. In this example, you define a Simulink.SimulationInput object in the base or model workspace to specify the
simulation scenarios to use for range collection. The Fixed-Point Tool merges the
results from two simulation runs and proposes a data type based on the merged ranges. Merging
results allows you to autoscale your model over the complete simulation range.
When converting a system based on multiple simulation scenarios, structurally altering the contents of the system under design during the conversion process could lead to errors. When defining the simulation scenarios avoid making any of the following changes to the system under design:
Add or delete a block in the system under design
Add another input to the system under design
Change a block type in the system under design
Set Up the Model
This example uses the ex_merge_ranges model. The model contains a sine wave input and two alternate noise sources, band-limited white noise and random uniform noise. In this example, define a Simulink.SimulationInput object and collect ranges using the Band-Limited White Noise source and the Random Number 1 source. Propose data types for the model based on the merged simulation ranges.
Open the model.
model = 'ex_merge_ranges';
open_system(model);

Define the Simulink.SimulationInput object. The first object sets the Manual Switch block to the Band-Limited White Noise source, the second SimulationInput object sets the Manual Switch block to the Random Number source.
simIn(1) = Simulink.SimulationInput(model);
simIn(2) = Simulink.SimulationInput(model);
simIn(1) = simIn(1).setBlockParameter('ex_merge_ranges/Manual Switch', 'sw', '0');
simIn(2) = simIn(2).setBlockParameter('ex_merge_ranges/Manual Switch', 'sw', '1');
Open the Fixed-Point Tool and Prepare the System for Conversion
In the Apps gallery of the
ex_merge_rangesmodel, select Fixed-Point Tool.In the Fixed-Point Tool, click New, and select
Iterative Fixed-Point Conversion.Under System Under Design, select
Subsystem.Under Range Collection Mode, select Simulation Ranges as the range collection method.
Under Simulation Inputs, select the
Simulink.SimulationInputobject,simInthat you defined in the base workspace.Set the absolute tolerance of the
Subsystem: 1signal to0.1, or 10%.In the toolstrip, click the Prepare button.
Collect Ranges and Convert to Fixed-Point
Expand the Collect Ranges button arrow and select
Double precision. Click Collect Ranges.Simulink® simulates the
ex_merge_rangesmodel twice, once using the Band-Limited White Noise source block and once using the Random Number source block.You can view the ranges of each simulation individually by selecting the simulation in the Workflow Browser. In this example the
BaselineRun_Scenario_1simulation had a SimMin value of-3.5821and a SimMax value of2.7598. TheBaselineRun_Scenario_2simulation had a SimMin value of-2.5317and a SimMax value of3.1542.Selecting the
BaselineRunnode in the Workflow Browser shows the merged ranges from the two simulation scenarios.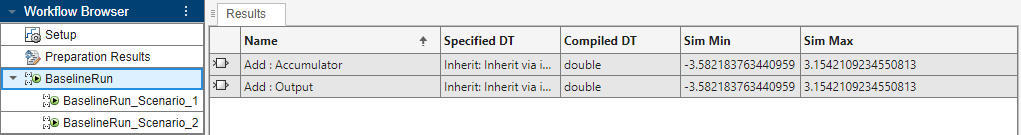
In the Convert section of the toolstrip, click the Propose Data Types button
 .
.The Fixed-Point Tool uses the merged minimum and maximum values to propose fraction lengths for each block. These values ensure maximum precision while spanning the full range of simulation values. The tool displays the proposed data types in the spreadsheet.
Click the Apply Data Types button
 to write the proposed data types to the model.
Verify Fixed-Point Behavior
In the Verify section of the toolstrip, click the Simulate with Embedded Types button
 . The Fixed-Point Tool simulates the model using the
same
. The Fixed-Point Tool simulates the model using the
same Simulink.SimulationInputscenarios that were used to collect ranges and verifies whether each scenario met the specified tolerances.The Workflow Browser indicates whether the verification runs met the tolerances. In this example, both simulation scenarios met the specified tolerances.

To view the simulation data for an individual run, right-click the run in the Workflow Browser.