Cluster Data Using Possibilistic FCM Clustering
By default, the fuzzy c-means (FCM) clustering algorithm uses probabilistic membership values where the sum of membership values across all clusters for each data point is equal to one. Clustering using probabilistic membership values assigns higher membership values to outliers in the data. As a result, data points that are relatively far from the cluster centers can have an out-size impact on values of the cluster centers.
To better handle outliers, you can use possibilistic membership values, where the cluster membership values for a given data point are independent. This membership type allow for more flexible membership values.
To demonstrate the differences between possibilistic and probabilistic FCM clustering, this example clusters sample data using both membership types.
Load Data
Load the data for this example, which contains 100 data points with three clusters and several outliers.
data = readmatrix("dataWithOutliers.csv");Probabilistic FCM Clustering
To cluster the data using the probabilistic membership type, first create an fcmOptions object. Set the following clustering options, keeping the remaining options at their default values.
Set the number of clusters to 3.
Suppress the output of the objective function values for each clustering iteration.
Use probabilistic clustering, which is the default value for the
ClusterMembershipTypeoption.
opts = fcmOptions;
opts.NumClusters = 3;
opts.Verbose = false;
Cluster the data using the fcm function and view the cluster centers. To ensure reproducibility, initialize the random number generator.
rng("default")
[C1,U1] = fcm(data,opts);
C1
C1 = 3×2
1.8820 1.9718
10.0081 2.0777
6.0350 6.0060
The clustering operation creates cluster centers, C1, and a partition matrix of cluster membership values, U1. For probabilistic clustering, the membership values for each data point must sum to 1 across all clusters; that is, the sum of each column in U1 sum is 1.
View the probabilistic clustering results.
plotFuzzyClusters(data,U1, ...
    ClusterCenters=C1, ...
    Title="Probabilistic Clustering")
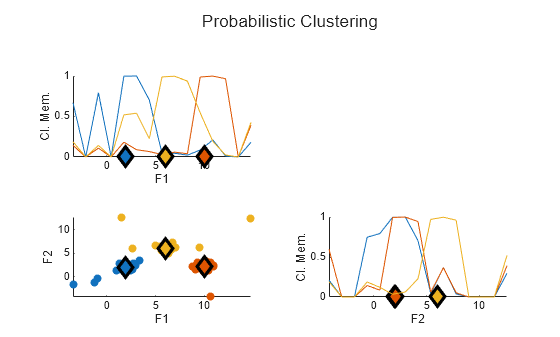
The diagonal axes in the plot show the membership values of the data points in each cluster for each feature. The outliers in the data, which are not close to cluster centers, have relatively high membership values in the range of about 0.4 to 0.8.
These higher membership values give the outliers a disproportionate impact on the cluster center values. For instance:
The outlier data points in the bottom left corner of the data plot pull the leftmost cluster center in the negative direction along both the F1 and F2 axes.
The outlier data points near the top of the data plot pull the middle cluster center in the positive direction along the F2 axis.
Possibilistic FCM Clustering with Random Initialization
To cluster the data using possibilistic membership values, set the ClusterMembershipType option to "possibilistic".
opts.ClusterMembershipType = "possibilistic";By default, the fcm function randomly initializes the cluster centers and membership values. Often, possibilistic FCM clustering does not perform well with such random initialization.
To demonstrate this issue, cluster the data with the default initialization and plot the results.
rng("default")
[C2,U2] = fcm(data,opts);
plotFuzzyClusters(data,U2, ...
    ClusterCenters=C2, ...
    Title="Possibilistic Clustering (Random Initial Membership)")
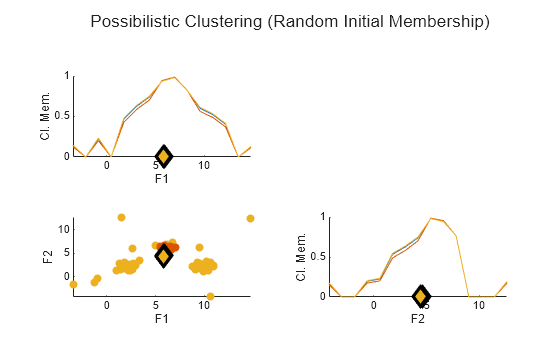
Without the probabilistic constraint of having the membership values for each data point sum to 1, the possibilistic FCM algorithm creates three essentially identical clusters.
Possibilistic FCM Clustering with Initial Membership Values
To address such maximal cluster overlap, you can specify an initial estimate of the cluster membership values.
One common method of defining initial membership values is to first classify the data using probabilistic FCM clustering and use the resulting partition matrix as the initial estimate.
opts.PartitionMatrix = U1;
Cluster the data and view cluster centers.
rng("default")
[C3,U3] = fcm(data,opts);
C3
C3 = 3×2
2.1130 2.1063
9.9744 2.0708
6.0038 5.7580
Plot the clustering results.
plotFuzzyClusters(data,U3, ...
    ClusterCenters=C3, ...
    Title="Possibilistic Clustering (Probabilistic Initial Membership)")
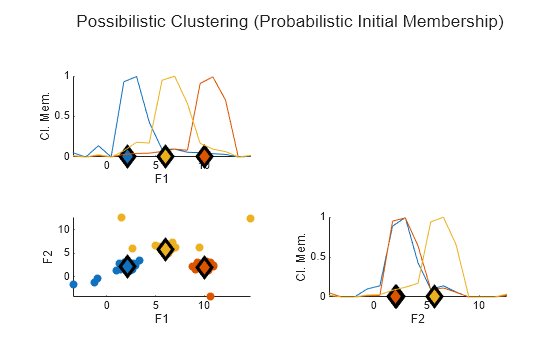
Here, the outliers in the data now have much lower membership values.
Identify Outliers
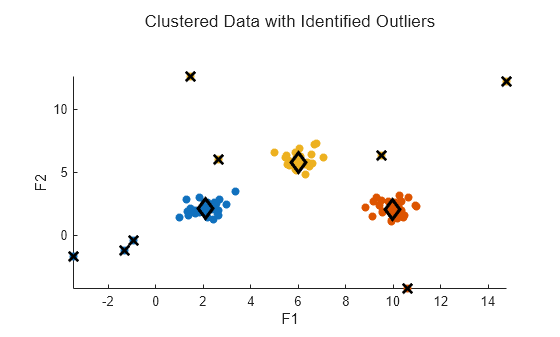
You can use the maximum membership value for each data point as a threshold for determining which points may be outliers.
For this example, find all data points where the maximum membership value is less than 0.2. This threshold, while somewhat arbitrary, is a good place to start for finding outliers.
maxU = max(U3);
index = find(maxU < 0.2);
Plot the clustering results again. This time, to get a better view of the data points, suppress the diagonal membership plots.
h = plotFuzzyClusters(data,U3, ...
    ClusterCenters=C3, ...
    Title="Clustered Data with Identified Outliers", ...
    ShowMembershipPlot=false);
Set the plot as the current axes and mark each outlier with a black X.
axes(h.Children)
hold on
plot3(data(index,1),data(index,2),maxU(index),"xk", ...
    LineWidth=2, ...
    MarkerSize=10)
View Shift in Cluster Centers
From the probabilistic clustering results earlier in the example, recall that high membership values on outliers pulled the:
Leftmost cluster center in the negative direction along the F1 and F2 axes
Middle cluster center in the positive direction along the F2 axis.
To validate these observations, calculate the shift in the cluster centers due to the change to possibilistic clustering.
Cshift = C3 - C1
Cshift = 3×2

    0.2310    0.1345
   -0.0337   -0.0069
   -0.0312   -0.2480
As expected, due to the lower membership values for the outlier data points:
The first cluster center, which corresponds to the leftmost cluster in the plot, shifted in the positive direction along both the F1 and F2 axes.
The third cluster center, which corresponds to the middle cluster in the plot, shifted in the negative direction along the F2 axis.