创建自定义绘图函数
关于自定义绘图函数
如果软件附带的绘图函数都不适合您要绘制的输出,您可以编写自己的自定义绘图函数,遗传算法在每代都会调用该函数来创建绘图。此示例显示如何创建一个绘图函数,显示从上代到当前代的最佳适应度值的变化。
创建自定义绘图函数
要为此示例创建绘图函数,请将以下代码复制并粘贴到 MATLAB® 编辑器中的新文件中。
function state = gaplotchange(options, state, flag)
% GAPLOTCHANGE Plots the logarithmic change in the best score from the
% previous generation.
%
persistent last_best % Best score in the previous generation

if(strcmp(flag,'init')) % Set up the plot
    xlim([1,options.MaxGenerations]);
    axx = gca;
    axx.YScale = 'log';
    hold on;
    xlabel Generation
    title('Log Absolute Change in Best Fitness Value')
end

best = min(state.Score); % Best score in the current generation
if state.Generation == 0 % Set last_best to best.
    last_best = best;
else
	change = last_best - best; % Change in best score
	last_best = best;
    if change > 0 % Plot only when the fitness improves
        plot(state.Generation,change,'xr');
    end
end
将文件作为 gaplotchange.m 保存到 MATLAB 路径上的某个文件夹中。
使用自定义绘图函数
要使用自定义绘图函数,请将其包含在选项中。
rng(100) % For reproducibility
options = optimoptions('ga','PlotFcn',{@gaplotbestf,@gaplotchange});
[x,fval] = ga(@rastriginsfcn,2,[],[],[],[],[],[],[],options)
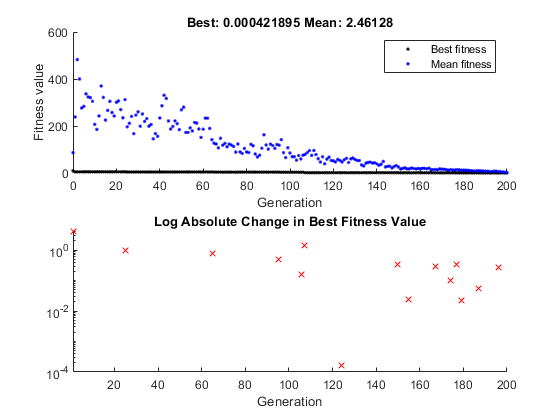
Optimization terminated: maximum number of generations exceeded.

x =

   -0.0003    0.0014


fval =

   4.2189e-04
该图仅显示大于 0 的变化,这是最佳适应度的改善。对数刻度使您能够看到上图未显示的最佳适应度函数的细微变化。
绘图函数的工作原理
绘图函数使用以下结构体中包含的信息,遗传算法将其作为输入参量传递给函数:
options- 当前选项设置state- 有关当前代的信息flag- 算法的当前状态
绘图函数中最重要的几行如下:
persistent last_best创建持久变量
last_best-上代中的最佳分数。持久变量在多次调用绘图函数时得以保留。xlim([1,options.MaxGenerations]);axx = gca;axx.YScale = 'log';在算法启动前设置图。
options.MaxGenerations是最大代数。best = min(state.Score)字段
state.Score包含当前种群中所有个体的分数。变量best是最低分数。有关结构体状态字段的完整描述,请参阅 绘图函数的结构。change = last_best - best变量的变化是上一代的最佳分数减去当前代的最佳分数。
if change > 0仅当最佳适应度发生变化时才绘制图表。
plot(state.Generation,change,'xr')绘制当前代的变化,其编号包含在
state.Generation中。
gaplotchange 的代码包含许多与 gaplotbestf(创建最佳适应度图的函数)的代码相同的元素。