使用 surrogateopt 进行最佳组件选择
此示例说明如何选择电路中的电阻器和热敏电阻以最佳匹配电路中某一点的指定曲线。您必须从可用分量列表中选择所有电子分量,这意味着这是一个离散优化问题。为了帮助可视化优化的进度,示例包含一个自定义输出函数,可显示优化过程中中间解的质量。因为这是一个具有非线性目标函数的整数问题,所以使用 surrogateopt 求解器。
此示例改编自 Lyon [1]。
问题描述
问题涉及该电路。
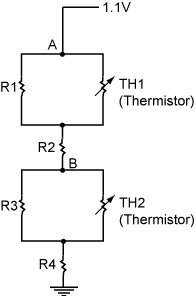
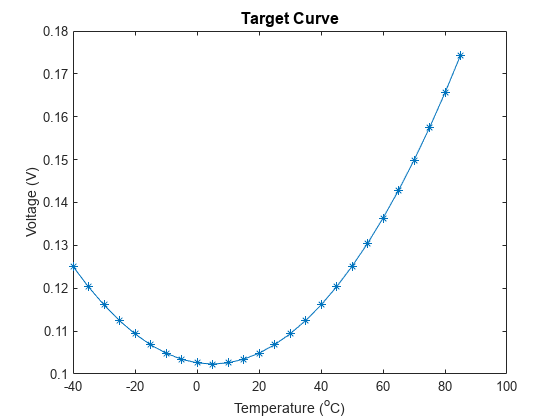
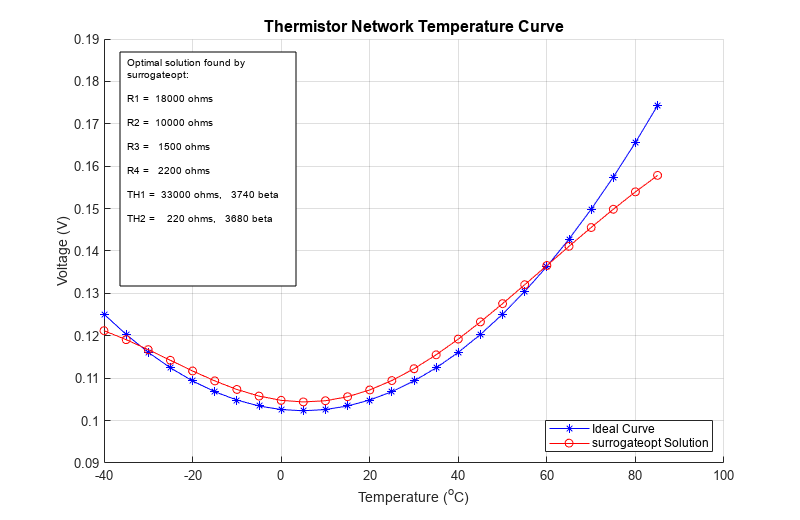
电压源将点 A 保持在 1.1V。问题是从标准分量列表中选择电阻器和热敏电阻,使得 B 点的电压与温度函数的目标曲线相匹配。
Tdata = -40:5:85;
Vdata = 1.026E-1 + -1.125E-4 * Tdata + 1.125E-5 * Tdata.^2;
plot(Tdata,Vdata,'-*');
title('Target Curve','FontSize',12);
xlabel('Temperature (^oC)'); ylabel('Voltage (V)')
加载标准分量列表。
load StandardComponentValuesRes 向量包含标准电阻值。ThBeta 和 ThVal 向量包含热敏电阻的标准参数。作为温度 的热敏电阻电阻函数为
是热敏电阻电阻。
是 25 摄氏度时的电阻,参数
ThVal。表示温度 25 摄氏度。
是当前温度。
是热敏电阻参数
ThBeta。
根据标准电压计算, 块电阻的等效串联值为
,
块的等效电阻为
.
因此,B 点的电压为
.
将问题转换为代码
问题是选择电阻器 到 以及热敏电阻 和 ,以便电压 与目标曲线最佳匹配。让控制变量 x 代表这些值:
x(i)= 的索引,对于i从 1 到 4x(5)= 的索引x(6)= 的索引
tempCompCurve 函数根据 x 和温度 Tdata 计算最终电压。
type tempCompCurvefunction F = tempCompCurve(x,Tdata) %% Calculate Temperature Curve given Resistor and Thermistor Values % Copyright (c) 2012-2019, MathWorks, Inc. %% Input voltage Vin = 1.1; %% Thermistor Calculations % Values in x: R1 R2 R3 R4 RTH1(T_25degc) Beta1 RTH2(T_25degc) Beta2 % Thermistors are represented by: % Room temperature is 25degc: T_25 % Standard value is at 25degc: RTHx_25 % RTHx is the thermistor resistance at various temperatures % RTH(T) = RTH(T_25degc) / exp (Beta * (T-T_25)/(T*T_25)) T_25 = 298.15; T_off = 273.15; Beta1 = x(6); Beta2 = x(8); RTH1 = x(5) ./ exp(Beta1 * ((Tdata+T_off)-T_25)./((Tdata+T_off)*T_25)); RTH2 = x(7) ./ exp(Beta2 * ((Tdata+T_off)-T_25)./((Tdata+T_off)*T_25)); %% Define equivalent circuits for parallel Rs and RTHs R1_eq = x(1)*RTH1./(x(1)+RTH1); R3_eq = x(3)*RTH2./(x(3)+RTH2); %% Calculate voltages at Point B F = Vin * (R3_eq + x(4))./(R1_eq + x(2) + R3_eq + x(4));
目标函数是目标温度范围内一组电阻器和热敏电阻的目标曲线与所得电压之间的差值的平方和。
type objectiveFunctionfunction G = objectiveFunction(x,StdRes, StdTherm_Val, StdTherm_Beta,Tdata,Vdata) %% Objective function for the thermistor problem % Copyright (c) 2012-2019, MathWorks, Inc. % % StdRes = vector of resistor values % StdTherm_val = vector of nominal thermistor resistances % StdTherm_Beta = vector of thermistor temperature coefficients % Extract component values from tables using integers in x as indices y = zeros(8,1); x = round(x); % in case of noninteger components y(1) = StdRes(x(1)); y(2) = StdRes(x(2)); y(3) = StdRes(x(3)); y(4) = StdRes(x(4)); y(5) = StdTherm_Val(x(5)); y(6) = StdTherm_Beta(x(5)); y(7) = StdTherm_Val(x(6)); y(8) = StdTherm_Beta(x(6)); % Calculate temperature curve for a particular set of components F = tempCompCurve(y, Tdata); % Compare simulated results to target curve Residual = F(:) - Vdata(:); Residual = Residual(1:2:26); %% G = Residual'*Residual; % sum of squares
监控进度
为了观察优化的进度,请调用输出函数,绘制迄今为止发现的系统最佳响应和目标曲线。SurrOptimPlot 函数绘制这些曲线,并仅当当前目标函数值减小时更新曲线。这个自定义输出函数比较冗长,所以这里就不展示了。要查看此输出函数的内容,请输入 type SurrOptimPlot。
优化问题
为了优化目标函数,使用接受整数变量的 surrogateopt。首先,将所有变量设置为整数。
intCon = 1:6;
将所有变量的下界设置为 1。
lb = ones(1,6);
电阻的上界都是相同的。将上界设置为 Res 数据中的条目数。
ub = length(Res)*ones(1,6);
将热敏电阻的上界设置为 ThBeta 数据中的条目数。
ub(5:6) = length(ThBeta)*[1,1];
设置选项以使用 SurrOptimPlot 自定义输出函数,并且不使用绘图函数。此外,为了防止优化可能中断,请指定一个名为 'checkfile.mat' 的检查点文件。
options = optimoptions('surrogateopt','CheckpointFile','C:\TEMP\checkfile.mat','PlotFcn',[],...
    'OutputFcn',@(a1,a2,a3)SurrOptimPlot(a1,a2,a3,Tdata,Vdata,Res,ThVal,ThBeta));
为了给算法提供更好的初始搜索点集,请指定比默认值更大的初始随机样本。
options.MinSurrogatePoints = 50;
运行优化。
rng default % For reproducibility
objconstr = @(x)objectiveFunction(x,Res,ThVal,ThBeta,Tdata,Vdata);
[xOpt,Fval] = surrogateopt(objconstr,lb,ub,intCon,options);
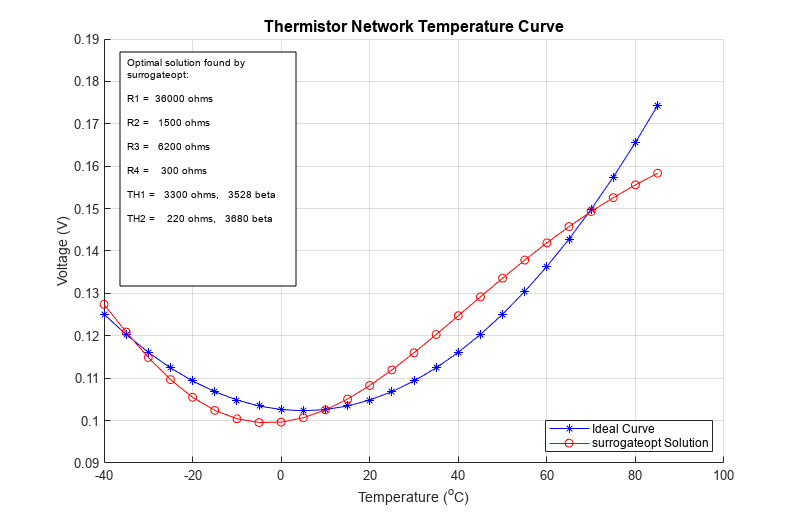
surrogateopt stopped because it exceeded the function evaluation limit set by
'options.MaxFunctionEvaluations'.
通过更多函数评估进行优化
为了尝试获得更好的拟合,请从检查点文件重新启动优化,并指定更多的函数计算。这次,使用 surrogateoptplot 绘图函数来更密切地监视优化过程。
clf % Clear previous figure
opts = optimoptions(options,'MaxFunctionEvaluations',600,'PlotFcn','surrogateoptplot');
[xOpt,Fval] = surrogateopt('C:\TEMP\checkfile.mat',opts);
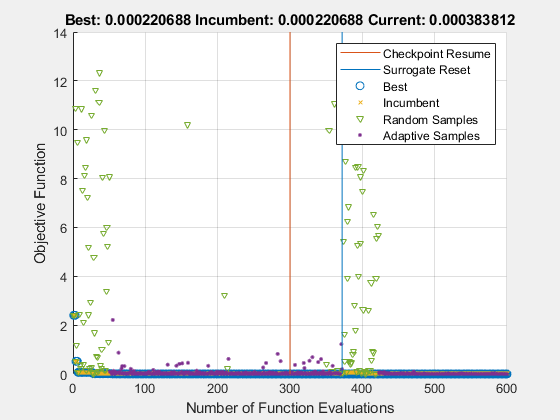
surrogateopt stopped because it exceeded the function evaluation limit set by
'options.MaxFunctionEvaluations'.
使用更多的函数计算会稍微改善拟合度。
参考资料
[1] Lyon, Craig K. Genetic algorithm solves thermistor-network component values.EDN Network, March 19, 2008.Available at https://www.edn.com/genetic-algorithm-solves-thermistor-network-component-values/.