Validating Flow Response with the Simulation Data Inspector
R2026bThis example shows the workflow for a unit test assessment of model suitability based on the mass flow rate through a valve by using the Simulation Data Inspector. Performing a successful validation ensures that you are using the most appropriate equations to model a specific application or phenomena. Testing a model's response in a test harness helps to assess the response of a model to a controlled range of inputs. You can find other test harness examples in Test Harnesses and Parameterization.
This tutorial uses the example 4-Way 3-Position Valve Parameterization example:
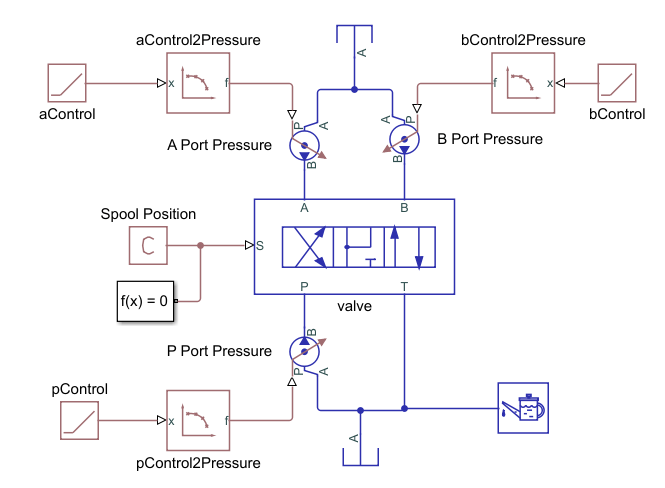
The 4-Way 3-Position Valve Parameterization example uses a script to
run and process the model and plot the simulation data. This tutorial shows an alternative way
to validate the model by using the Simulation Data Inspector. Open the model by entering
openExample('simscapefluids/FourWayThreePositionValveParameterizationExample')
at the command line.
Build a Test Harness
To collect simulation data to validate the four-way valve, construct a unit test that
interrogates the valve at a range of pressures. The
FourWayThreePositionValveParameterization model is an example of a
four-way valve in a test harness. The model uses a Ramp block and a PS-Lookup Table (1D)
block to set the testing range of the valve. The ramp block specifies the simulation time
and the look-up table specifies the validating data range. In the
FourWayThreePositionValveParameterization model:
Mass flow rate is the chosen variable to validate against specification sheet data. The test harness is configured to steadily increase pressure from 0 to 5.8 bar.
The specification sheet data is for maximum open area, which is when the spool positions are fully extended in the positive and negative positions. The simulation runs two tests: one for the flow paths open at the maximum positive position, and one for the flow paths open at the maximum negative spool position.
Configure the model and your validating data:
Store validating data in a Simulation Data Inspector-friendly format. The validating data is specified as volumetric flow rate for pressure differential over the four valve flow paths. However, the data need to be converted to a timeseries in order to compare it in the Data Inspector with the simulation results:
The specification sheet data is in lpm. To match the simulation default units, the data set is multiplied byflowRateData_PB = timeseries(0.0166*[0.58 9.45 20.6 29.9 41.7 55.9 69.3 82.2 94 107 120],linspace(0,100,11)); flowRateData_PB.Name = 'Mass Flow Rate PB'; save validating_data.mat flowRateData_PB
0.0166to convert the data to kg/s.In
FourWayThreePositionValveParameterization, the valve performance is modeled by default with tabulated data. Use a linear model by setting the valve Orifice parameterization parameter toLinear - Area vs. spool travel:set_param('FourWayThreePositionValveParameterization/valve','valve_spec',... 'fluids.isothermal_liquid.valves_orifices.directional_control_valves.enum.directional_valve_spec.linear')
Collect Simulation Data
Log the valve data so it can be used in the Simulation Data Inspector. To log the data:
In Modeling, navigate to Model Settings > Model Settings, and select Data Import/Export.
Select Record logged workspace data in Simulation Data Inspector.
Run the model.
When the data are recorded in the Simulation Data Inspector, they are saved there under
the block name and port. For example, in a test harness saved as
FourWayThreePositionValveParameterization.slx, the mass flow rate in
the valve block between ports P and B is saved as
simlog_FourWayThreePositionValveParameterization.valve.valve_4_way.orifice_PB.mdot_A.series.values.
Assess Model Results
Open the Simulation Data Inspector.
In the Simulation Data Inspector, import your validating data.
Click Import. For Import from:, select Base workspace and then select the pressure timeseries data Mass Flow Rate PB. The import pane displays timeseries data currently in your workspace.
In the To section, ensure that New run is selected and that the time series data Mass Flow Rate PB is checked. Click Import.
In the left-hand pane, click Compare.
Set Baseline to Signals > Mass Flow Rate PB.
Set Compare to to Signals > FourWayThreePositionValveParameterization.valve.valve_4_way.orifice_PB.mdot_A (Run 1: FourWayThreePositionValveParameterization). This run contains the signal data from when the P-B orifice is in open in the positive and neutral positions.
The tolerance of your comparison is the precision to which you can validate your model. Depending on the size of a signal, the Simulation Data Inspector uses either the relative or the absolute tolerance for validation:
Global absolute tolerance is the absolute range of acceptable variation between data and a simulation point.
Global relative tolerance signifies the maximum acceptable difference between data and a simulation point relative to the data and simulation values.
Global time tolerance signifies the range in time one value can be compared to another.
For more information on Simulation Data Inspector tolerances, see How the Simulation Data Inspector Compares Data.
The absolute and relative tolerances should be equal to or larger than the solver tolerance. Click Options, and set the absolute and relative tolerances to
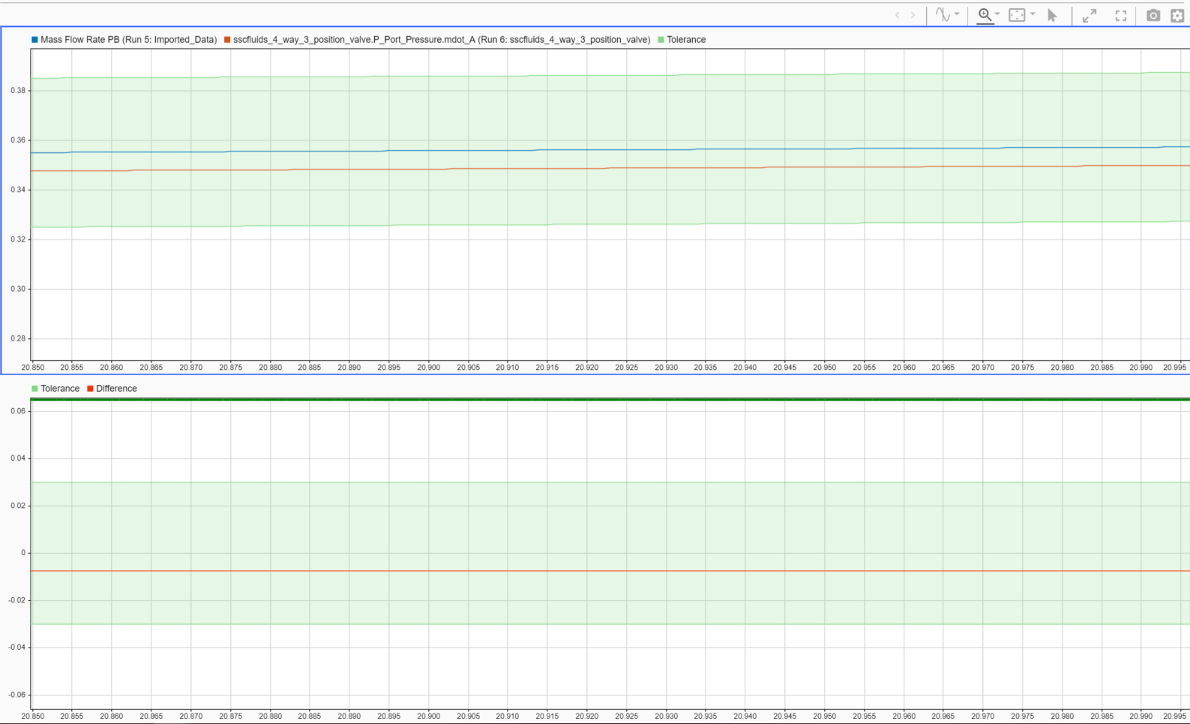
0.03and set the time tolerance to0. A nonzero time tolerance value is useful when you expect an impulse response during simulation.Click Compare. The simulation and data appear with the tolerance bounding lines:
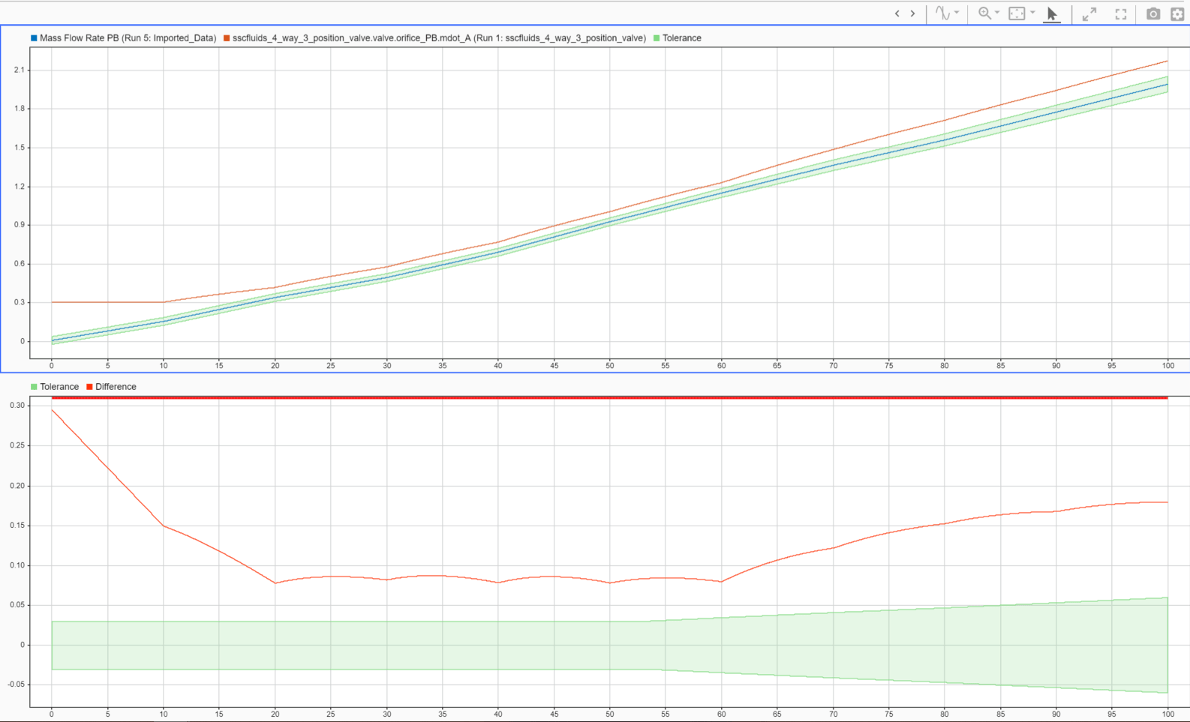
With relative and absolute tolerances of 0.03, the linear model is out of tolerance with the data. When the simulation results are fully within the green band limits, the valve is validated for the tested range of the simulation. The shape of the error suggests that it isn't the most suitable model for the application.
The default parameterization of
FourWayThreePositionValveParameterization is the same tabulated data as
the specification sheet. To see a model in the Simulation Data Inspector that is fully in
tolerance, set Orifice parameterization to Tabulated data
- Volumetric flow rate vs. spool travel and pressure
drop:
set_param('FourWayThreePositionValveParameterization/valve','valve_spec',...
 'fluids.isothermal_liquid.valves_orifices.directional_control_valves.enum.directional_valve_spec.table2D_volflow_opening_pressure')