使用 L*a*b* 颜色空间实现基于颜色的分割
此示例说明如何通过分析 L*a*b* 颜色空间来识别织物中的不同颜色。
步骤 1:采集图像
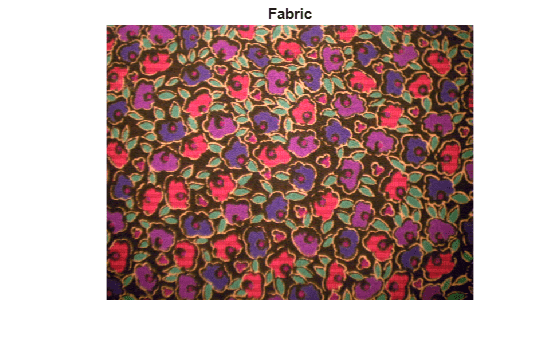
在 fabric.png 图像中读取,这是一个彩色织物图像。
fabric = imread("fabric.png");
imshow(fabric)
title("Fabric")
步骤 2:基于 L*a*b* 颜色空间计算每个区域的样本颜色
您可以在图像中看到六种主要颜色:背景色、红色、绿色、紫色、黄色和洋红色。请注意,您可以很轻松地在视觉上区分这些颜色。L*a*b* 颜色空间(也称为 CIELAB 或 CIE L*a*b*)使您能够量化这些视觉差异。
L*a*b* 颜色空间是从 CIE XYZ 三色值派生的。L*a*b* 空间包含指示明亮度的亮度通道 'L*'、指示颜色落在红-绿轴上位置的色度通道 'a*' 和指示颜色落在蓝-黄轴上位置的色度通道 'b*'。
您的方法是为每种颜色选择一个小样本区域,并计算每个样本区域的基于 a*b* 空间的平均颜色。您将使用这些颜色标记对每个像素进行分类。
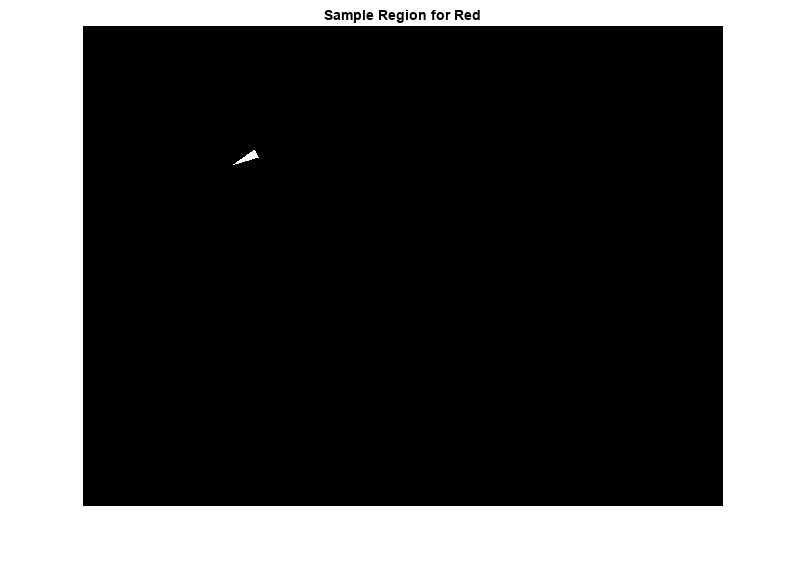
为了简化此示例,请加载存储在 MAT 文件中的区域坐标。
load regioncoordinates;

nColors = 6;
sample_regions = false([size(fabric,1) size(fabric,2) nColors]);

for count = 1:nColors
  sample_regions(:,:,count) = roipoly(fabric,region_coordinates(:,1,count), ...
      region_coordinates(:,2,count));
end

imshow(sample_regions(:,:,2))
title("Sample Region for Red")
使用 rgb2lab 函数将您的织物 RGB 图像转换为 L*a*b* 图像。
lab_fabric = rgb2lab(fabric);
计算您用 roipoly 提取的每个区域的 'a*' 和 'b*' 均值。这些值用作基于 'a*b*' 空间的颜色标记。
a = lab_fabric(:,:,2);
b = lab_fabric(:,:,3);
color_markers = zeros([nColors, 2]);

for count = 1:nColors
  color_markers(count,1) = mean2(a(sample_regions(:,:,count)));
  color_markers(count,2) = mean2(b(sample_regions(:,:,count)));
end
例如,基于 a*b* 空间的红色样本区域平均颜色为
disp([color_markers(2,1), color_markers(2,2)]);
69.8278 20.1056
步骤 3:使用最近邻规则对每个像素进行分类
现在每个颜色标记都有一个 a* 和一个 b* 值。您可以通过计算 lab_fabric 图像中每个像素与每个颜色标记之间的欧几里德距离对该像素进行分类。最小距离表示像素最接近该颜色标记。例如,如果某像素和红色标记之间的距离最小,则该像素将被标记为红色像素。
创建一个包含您的颜色标签的数组:0 表示背景,1 表示红色,2 表示绿色,3 表示紫色,4 表示洋红色,5 表示黄色。
color_labels = 0:nColors-1;
初始化用于最近邻分类的矩阵。
a = double(a);
b = double(b);
distance = zeros([size(a), nColors]);
执行分类。
for count = 1:nColors
  distance(:,:,count) = ( (a - color_markers(count,1)).^2 + ...
      (b - color_markers(count,2)).^2 ).^0.5;
end

[~,label] = min(distance,[],3);
label = color_labels(label);
clear distance;
步骤 4:显示最近邻分类的结果
标签矩阵包含织物图像中每个像素的颜色标签。使用标签矩阵按颜色分离原始织物图像中的目标。
rgb_label = repmat(label,[1 1 3]);
segmented_images = zeros([size(fabric), nColors],"uint8");

for count = 1:nColors
  color = fabric;
  color(rgb_label ~= color_labels(count)) = 0;
  segmented_images(:,:,:,count) = color;
end
以蒙太奇方式显示五种分割颜色。同时显示图像中未归类为颜色的背景像素。
montage({segmented_images(:,:,:,2),segmented_images(:,:,:,3) ...
    segmented_images(:,:,:,4),segmented_images(:,:,:,5) ...
    segmented_images(:,:,:,6),segmented_images(:,:,:,1)});
title("Montage of Red, Green, Purple, Magenta, and Yellow Objects, and Background")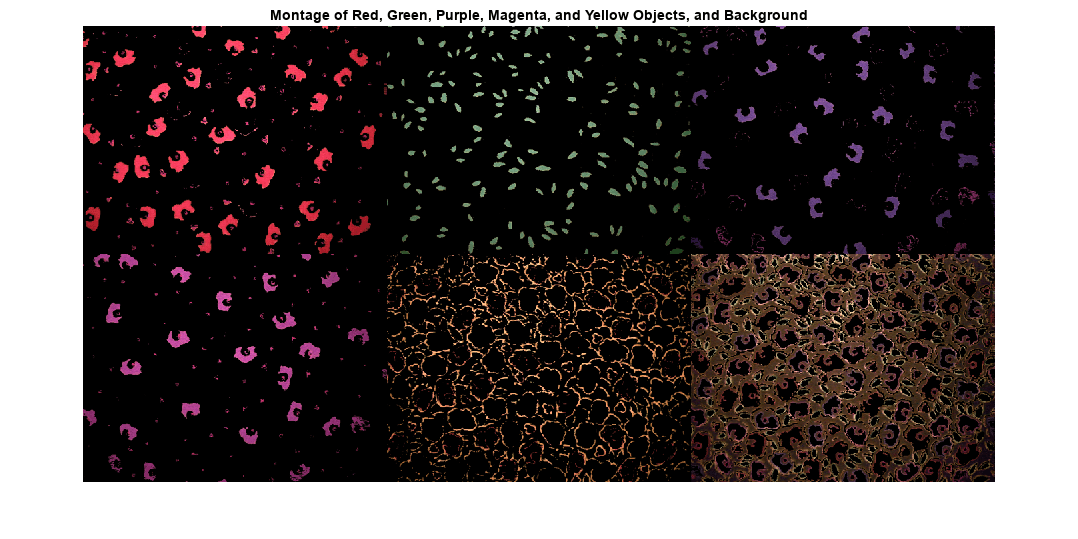
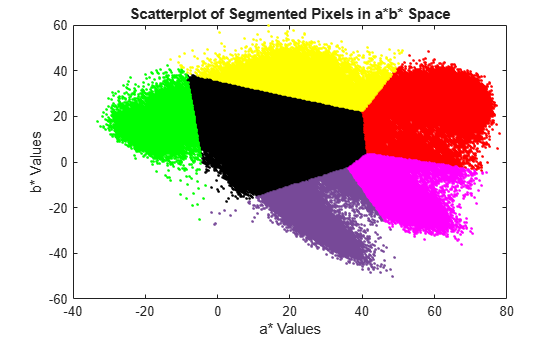
步骤 5:显示已标注颜色的 a* 和 b* 值
通过绘制分类为不同颜色的像素的 a* 和 b* 值,您可以看到最近邻分类对不同颜色总体的区分情况。出于显示目的,用颜色标签标注每个点。紫色不是已命名颜色值,因此使用具有十六进制颜色代码的字符串来指定紫色。
purple = "#774998";
plot_labels = ["k", "r", "g", purple, "m", "y"];

figure
for count = 1:nColors
    plot_label = plot_labels(count);
    plot(a(label==count-1),b(label==count-1),".", ...
       MarkerEdgeColor=plot_label,MarkerFaceColor=plot_label);
  hold on
end

title("Scatterplot of Segmented Pixels in a*b* Space")
xlabel("a* Values")
ylabel("b* Values")