Using the Test & Measurement Tool
Note
The Test and Measurement Tool app will be removed in a future release. Use the TCP/IP Explorer, UDP Explorer, Serial Explorer, or VISA Explorer app instead.
Overview of the Examples
These examples illustrates a typical session using the Test & Measurement Tool for instrument control. The session entails communicating with a Tektronix® TDS 210 oscilloscope via a GPIB interface.
To start the tool, on the MATLAB® Command window, type:
tmtool
Hardware
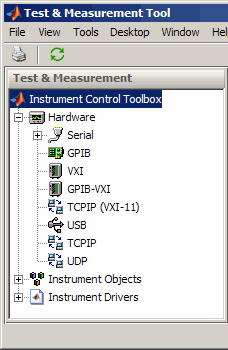
When the tool displays, expand (click the +) the
Instrument Control Toolbox node in the tree. Next, expand the
Hardware node. The tree now looks like this.
Selecting the Interface and Scanning for GPIB Boards
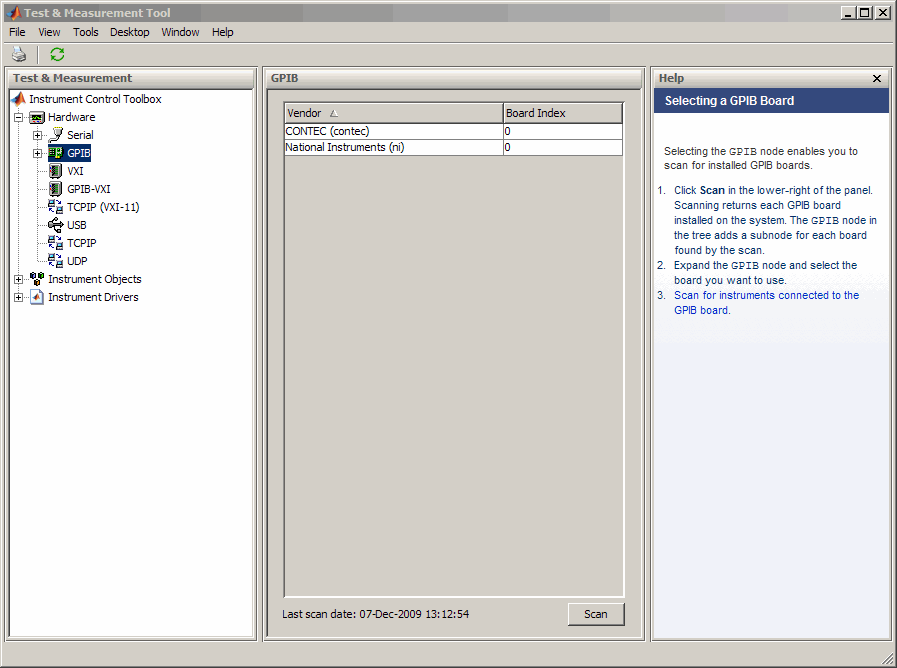
Next, scan for installed GPIB boards by selecting the GPIB
node. The right pane changes to the Installed GPIB
Board list. Click Scan to see what boards
are installed. The following figure shows the scan result from a system with one
Capital Equipment Corp and one Keithley® GPIB board.
Scanning for Instruments Connected to GPIB Boards
After determining what GPIB boards are installed, you must determine what
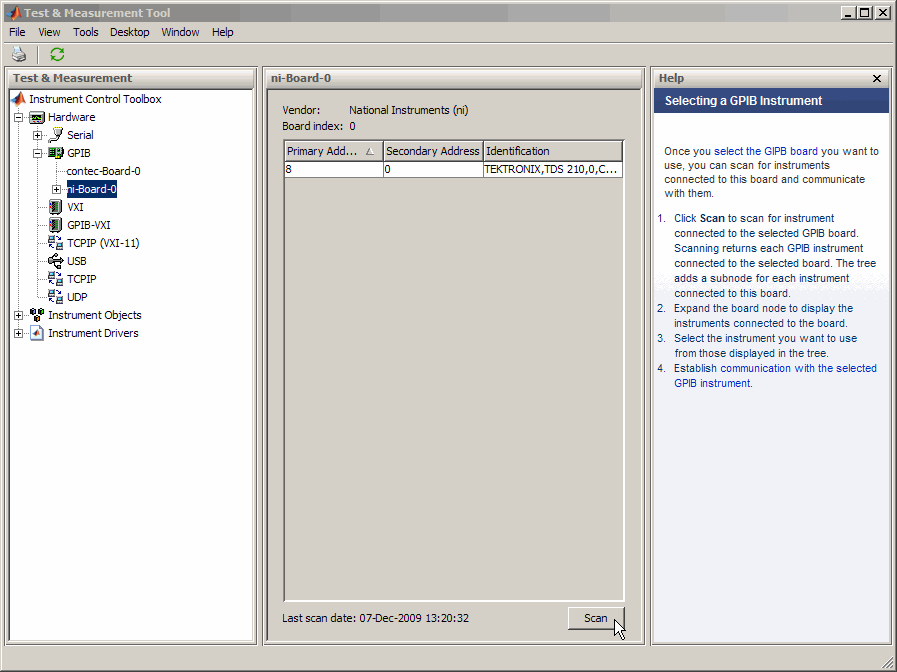
instruments are connected to those boards. Expand the GPIB
node and select a board.
The right pane changes to the GPIB Instruments list. Click Scan to see what instruments are connected to this board. The following figure shows the scan result from a system with a Tektronix TDS 210 connected at primary address 8ˋ.
Configuring the Interface
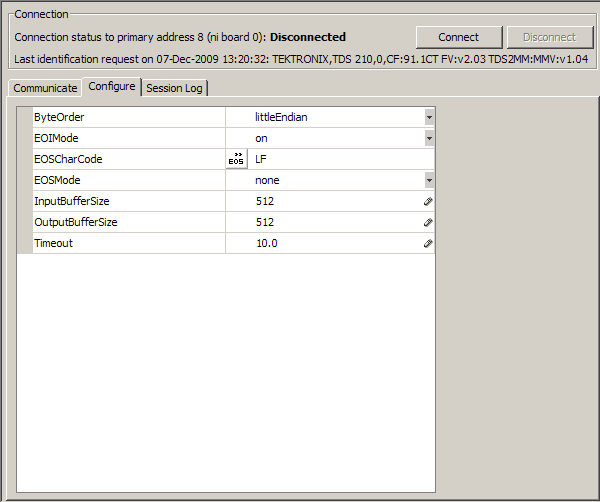
You can change the configuration of the interface by clicking the
Configure tab. This pane displays properties you can
set to configure the instrument communication settings. In the following view of
the Configure pane, the Timeout
property value has been set to 10 seconds.
Establishing the Connection
Expand the ni-Board-0 node and select the instrument at
primary address 4: PAD-8 (TEKTRONIX,TDS 210...). The right
pane changes to the control pane you use for writing and reading data to and
from that instrument.
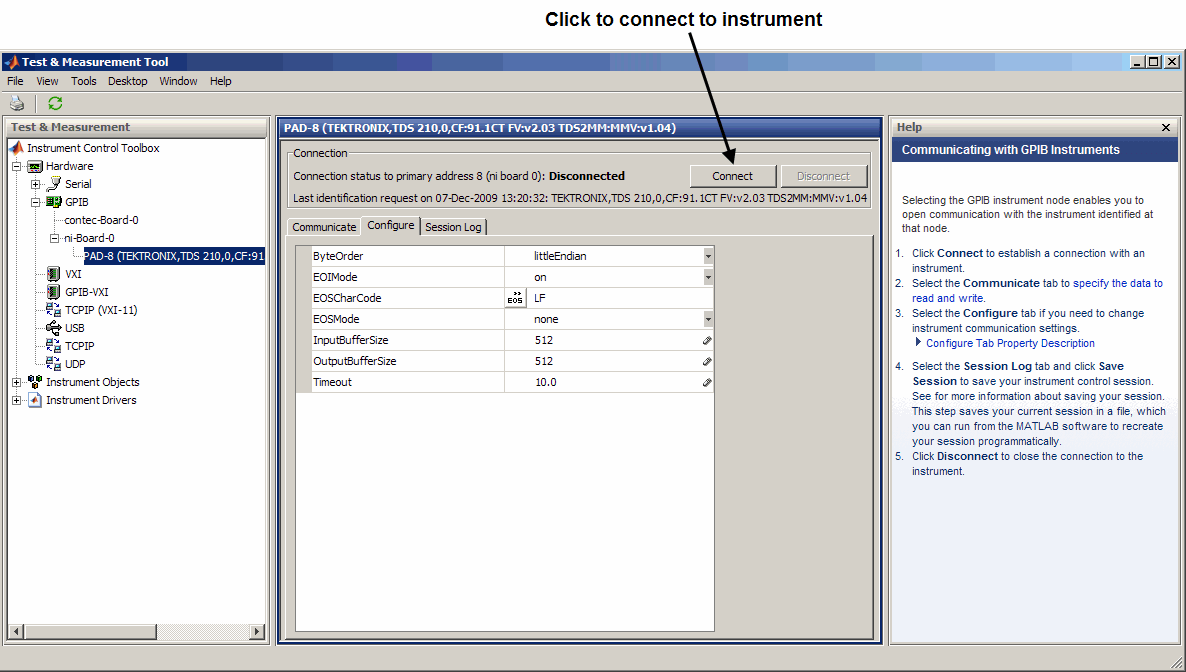
Click Connect to establish communication with the instrument. The tool creates an interface object representing the communication channel to the instrument.
Writing and Reading Data
Selecting the Communicate tab displays the pane you use to write and read data. You can write and read data separately using the Write and Read buttons, or you can use the Query button to write and read in a single operation.
The following figure shows the pane after a brief session involving the following steps:
Open communication with the instrument.
Enter
*IDN?as Data to Write, and click Query (write/read). This executes the identify command.Enter
CURVE?as Data to Write, and click Query. This retrieves the waveform data from the scope.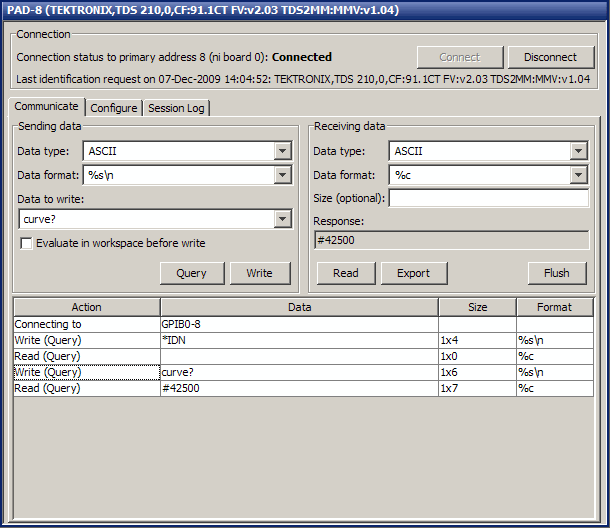
Exporting Instrument Data
You can export the data acquired from instruments to any of the following:
MATLAB workspace as a variable
Figure window as a plot
MAT-file for storage in a file
The MATLAB Variables editor for modification
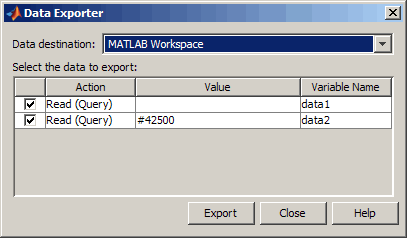
To export data, select File > Export > Instrument Response(s) from the menu bar. When the Data Exporter dialog box opens, choose
the variables to export. The following figure shows the Data Exporter set to
export the curve data to the MATLAB workspace as the variable data2.
Note
If you repeatedly generate a large amount of data in the Test and Measurement tool, you must delete the data object after you export it to MATLAB. This will allow the tool to return resources to MATLAB correctly and will prevent MATLAB from failing to respond the next time you acquire data.
Exporting the GPIB Object
When you open a connection to an instrument, the Test & Measurement Tool creates an instrument object automatically. You can export the GPIB instrument object created in this example as any of the following:
MATLAB workspace object that you can use as an argument in instrument control commands
File containing the call to the GPIB constructor and the commands to set object properties
MAT-file for storage in a file
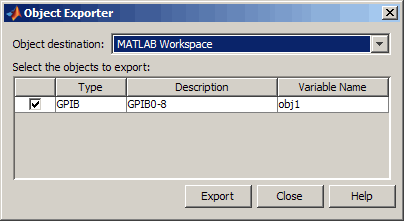
To export the object, select File > Export > Instrument Object from the menu bar. When the Object Exporter dialog box opens, choose the object to export. The following figure shows the Object Exporter set to export the object to a file. (When you run that file, it creates a new object with the equivalent settings.)
Saving Your Instrument Control Session. The Session Log tab displays the code equivalent of your instrument control session. You can save this code to a file so that you can execute the same commands programmatically.
Select File > Save Session Log from the menu bar or click Save Session. From this dialog box you can specify a file name and directory location for the file.
Instrument Objects
Interface Objects
The Test & Measurement Tool creates interface objects automatically when you open a communication channel to an instrument by clicking the Communication Status button. To explicitly create and configure an interface object:
Expand the
Instrument Objectsnode in the tree, and selectInterface Objects. The Interface Objects pane appears on the right.Click New Object to open the New Object Creation dialog box.
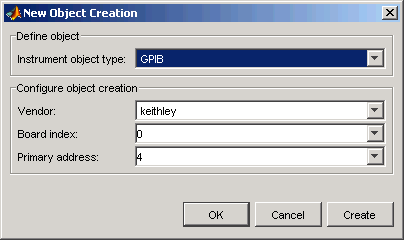
Specify the object parameters and click OK to create the new object.
Device Objects
To create and configure a device object:
Expand the
Instrument Objectsnode in the tree, and selectDevice Objects. The Device Objects pane appears on the right.Click New Object to open the New Object Creation dialog box. In this case, the Instrument object type is already set for
device.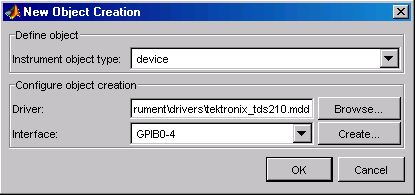
Specify or browse for the instrument driver you want to use; then choose from among the available interface objects, or create one if necessary.
Click OK to create the new device object.
Setting Instrument Object Properties
Whether the instrument objects are created automatically, created through the New Object Creation dialog box, or created on the MATLAB Command window, the Test & Measurement Tool enables you to set the properties of these objects. To change object properties in the Test & Measurement Tool:
Expand the
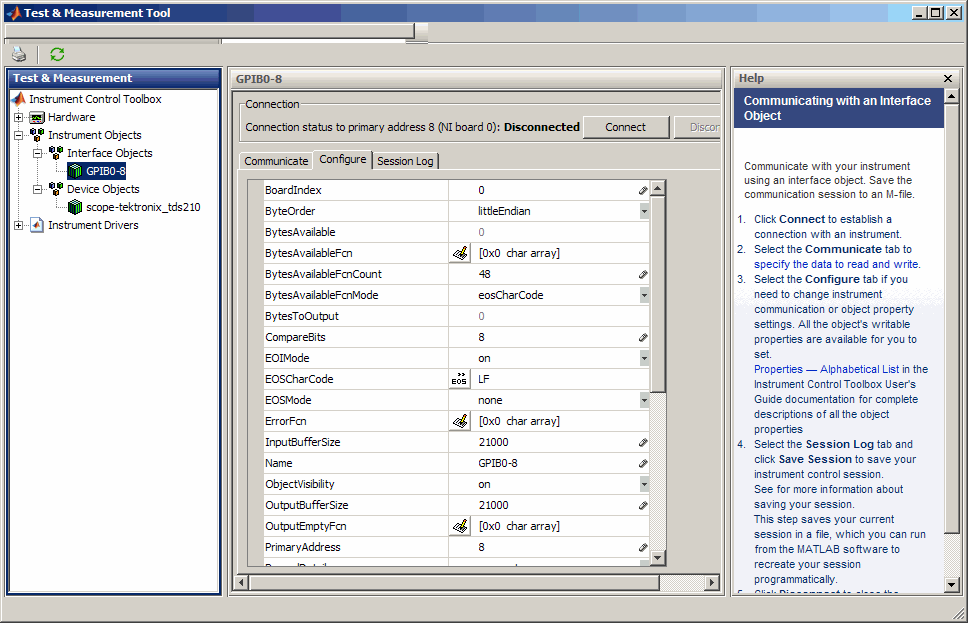
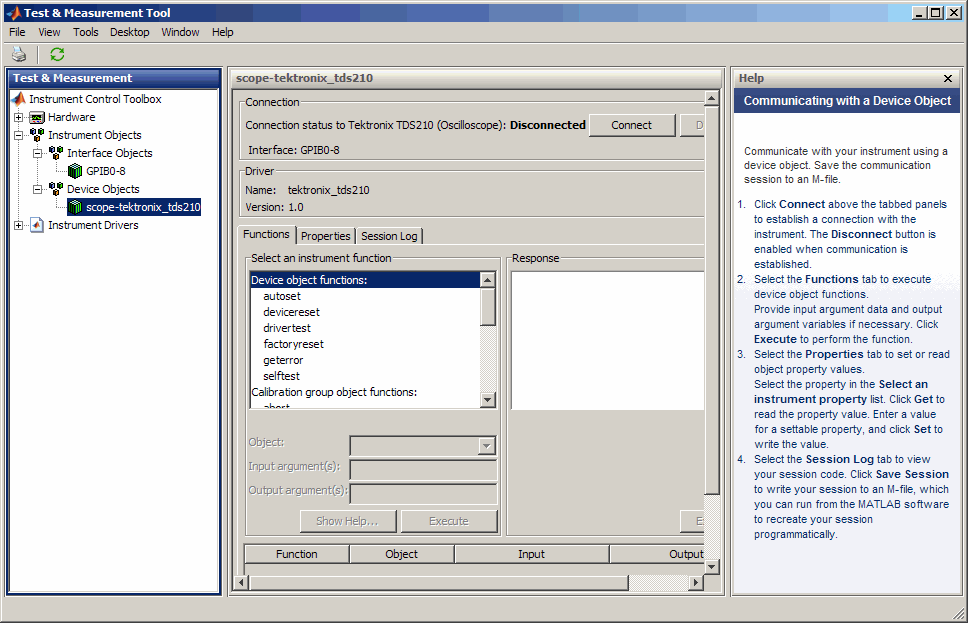
Instrument Objectsnode in the tree, then eitherInterface ObjectsorDevice Objects, and select the object whose properties you want to set.Click the Configure tab in the right pane.
Set properties displayed in this pane, as shown in the following figures.
Configuring Interface Object Properties
Configuring Device Object Properties
Communicating with Your Instrument
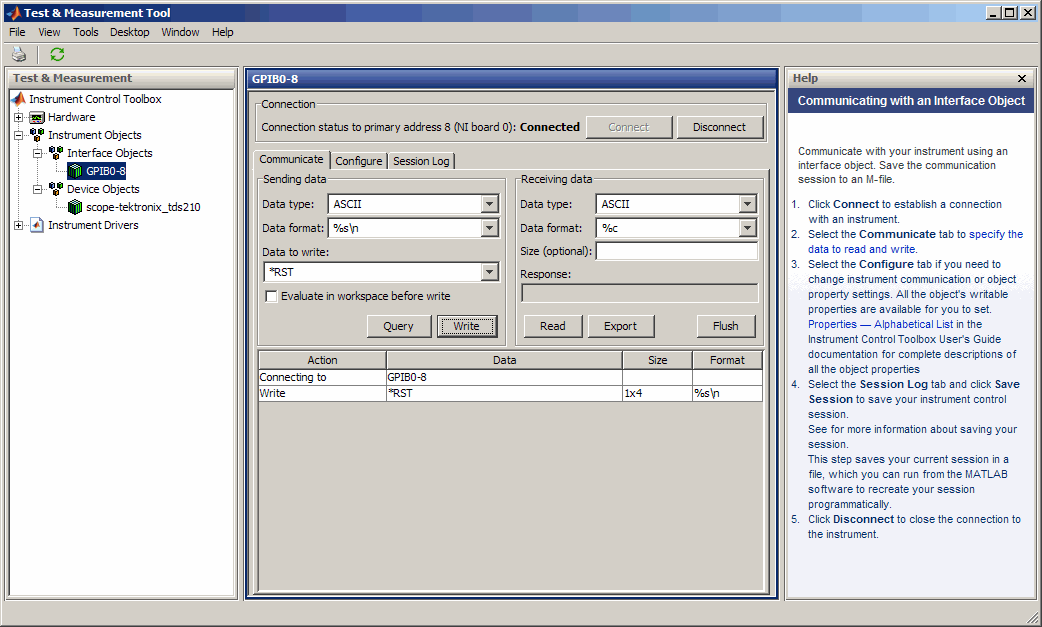
Using an Interface Object. When communicating with your instrument using an interface object, you
send data to instrument in the form of raw instrument commands. In the
following figure, the Test & Measurement Tool sends the
*RST string to the TDS 210 oscilloscope via an
interface object. *RST is the oscilloscope's reset
command.
Communicating via an Interface Object
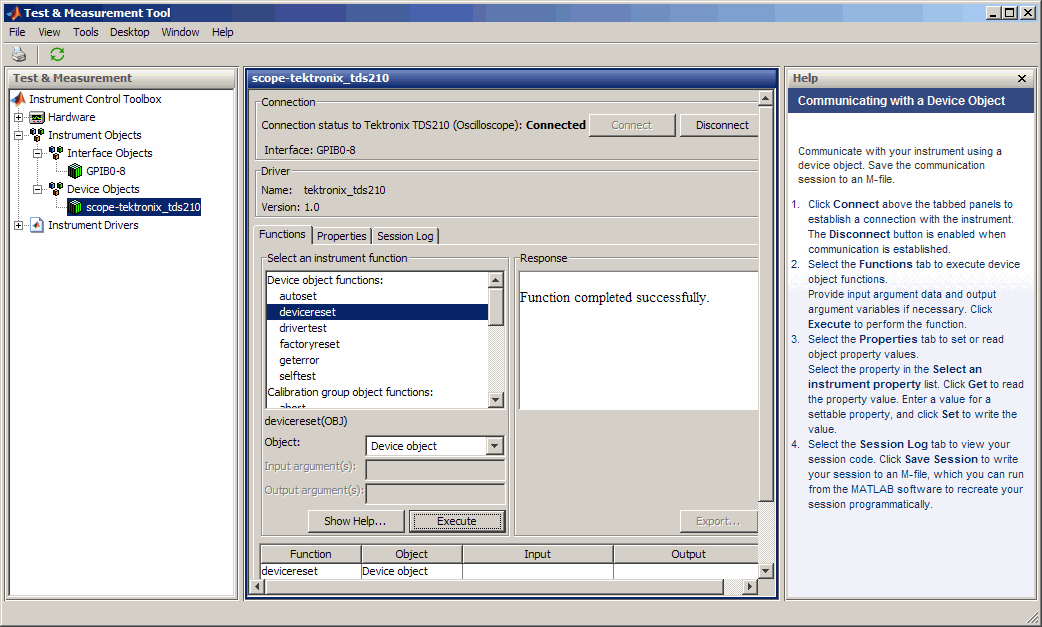
Using a Device Object. When communicating with your instrument using a device object, instead of employing instrument commands, you invoke device object methods (functions) or you set device object properties as provided by the MATLAB instrument driver for that instrument.
In the following figure, the Test & Measurement Tool resets a
TDS 210 oscilloscope by issuing a call to the
devicereset function of the instrument driver.
Communicating this way, you don't need to know what the actual oscilloscope
reset command is.
Communicating via a Device Object
Instrument Drivers
The Test & Measurement Tool enables you to scan for installed drivers, and to use those drivers when creating device objects.
MATLAB Instrument Drivers
MATLAB instrument drivers include
MATLAB interface drivers
MATLAB VXIplug&play drivers
MATLAB IVI® drivers
Select the MATLAB Instrument Drivers node in the tree. Then
click Scan to get an updated display of all the installed
MATLAB instrument drivers found on the MATLAB software path.
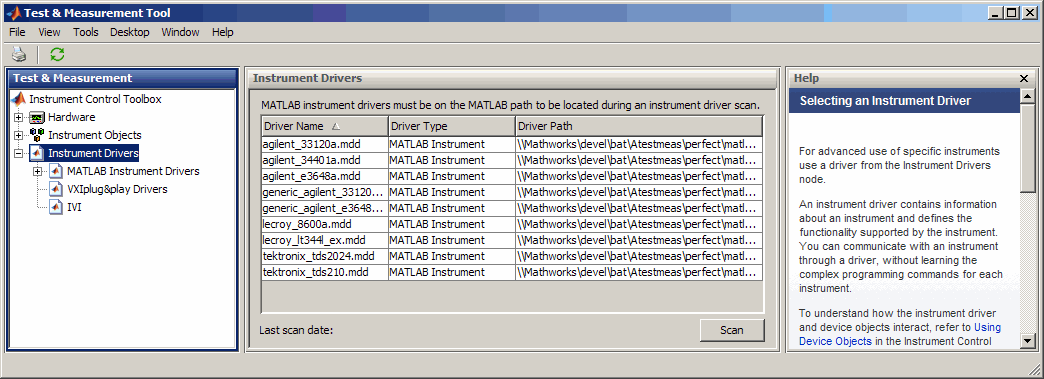
When the Test & Measurement Tool scans for drivers, it makes them
available as nodes under the driver type node. Expand the MATLAB
software Instrument Drivers node to reveal the installed drivers.
Select one of them to see the driver's details.
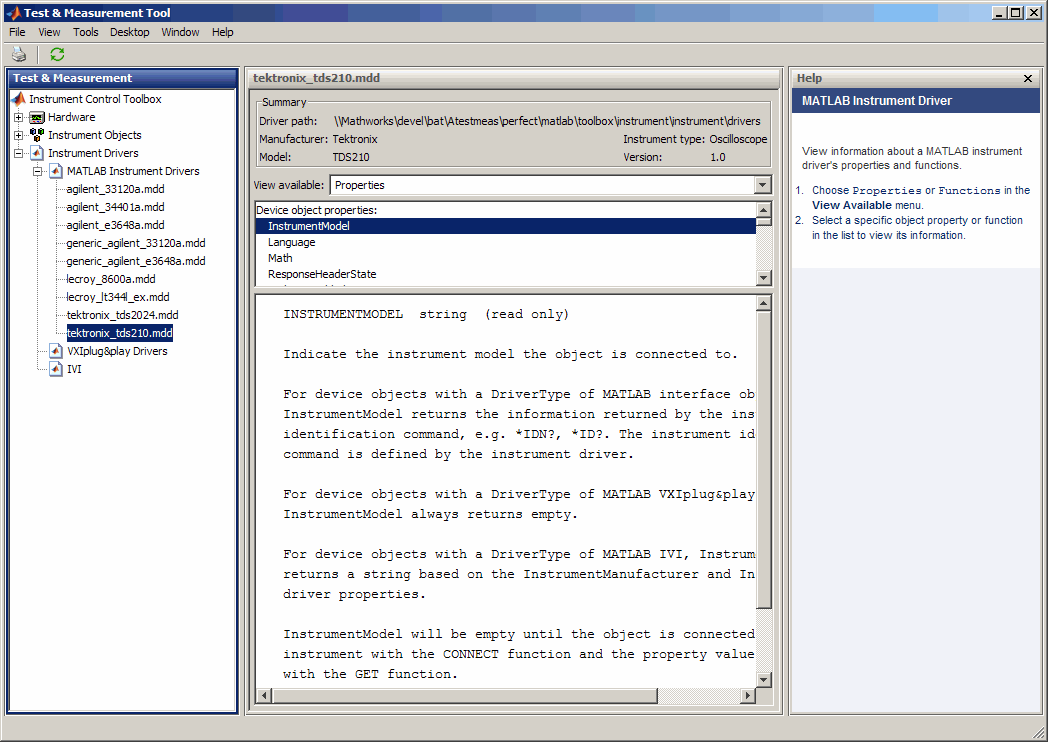
You can choose to see the driver's properties or functions. When you select the particular property or function, the tool displays that item's description.