Combine Vector and Raster Geodata on the Same Map
Vector map variables and data grid variables are often used or displayed together. For example, continental coastlines in vector form might be displayed with a grid of temperature data to make the latter more useful. When several map variables are used together, regardless of type, they can be referred to as a single map. To do this, of course, the different data sets must use the same coordinate system (i.e., geographic coordinates on the same ellipsoid or an identical map projection).
Combining Raster Data and Vector Data on the Same Map
This example shows how to combine raster data and vector data on the same axesm-based map using the geoshow function.
First, load elevation raster data and a geographic cells reference object. Get the coordinates of coastlines as vectors.
load topo60c
load coastlines
Create an axesm-based map using a Robinson projection. Then, display the raster and apply a colormap appropriate for elevation data.
axesm robinson
geoshow(topo60c,topo60cR,'DisplayType','texturemap')
demcmap(topo60c)
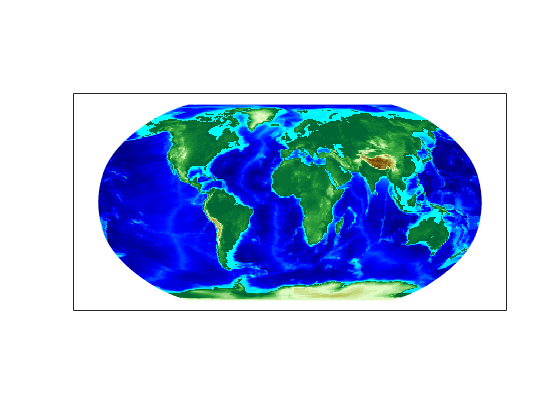
Display the vectors in red on top of the elevation map.
geoshow(coastlat,coastlon,'Color','r')
