Create and Display Polygons
Polygons represent geographic objects that cover area, such as continents, islands, and lakes. They may contain holes or multiple regions. Create a polygon by listing vertices that define its boundaries without intersecting. The order of the vertices determines what parts of the polygon are filled. List external boundaries clockwise and internal boundaries counterclockwise, such that the inside of the polygon is always to the right of the boundary.

Simple Polygon
Display a simple polygon with one region and no holes. First, list its vertices in a clockwise order. Close the polygon by repeating the first vertex at the end of the list.
x1 = [0 3 4 1 0];
y1 = [0 1 3 2 0];
Display the vertices as a polygon using the mapshow function by specifying 'DisplayType' as 'polygon'.
mapshow(x1,y1,'DisplayType','polygon')

Polygons with Holes or Multiple Regions
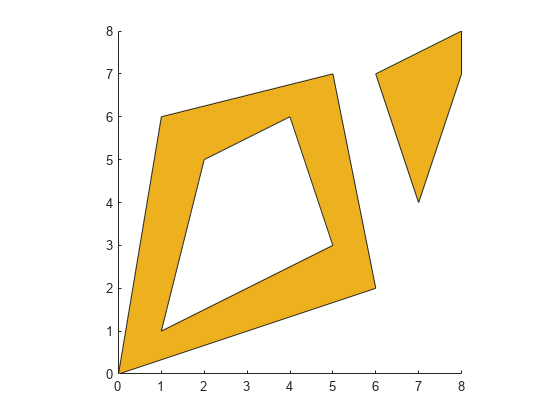
Define polygons with multiple regions or holes by separating the boundaries with NaN values. List the vertices of external boundaries in a clockwise order and the vertices of internal boundaries in a counterclockwise order.
x2 = [0 1 8 6 0 NaN 1 4 2 1 NaN 5 6 7 3 5];
y2 = [0 6 8 2 0 NaN 1 3 5 1 NaN 3 5 7 6 3];
These vectors define a polygon with one external boundary and two internal boundaries. The boundaries are separated using NaN values. Verify the vertex order of the boundaries using the ispolycw function. The ispolycw function returns 1 when the vertices are in a clockwise order.
ispolycw(x2,y2)
ans = 1×3 logical array

   1   0   0
Display the polygon. The internal boundaries create holes within the polygon.
figure
mapshow(x2,y2,'DisplayType','polygon')

Now, list the vertices for a polygon with two nonintersecting regions. One of the regions has a hole. Verify the vertex order of the boundaries using ispolycw.
x3 = [0 1 5 6 0 NaN 1 5 4 2 1 NaN 7 6 8 8 7];
y3 = [0 6 7 2 0 NaN 1 3 6 5 1 NaN 4 7 8 7 4];
ispolycw(x3,y3)
ans = 1×3 logical array

   1   0   1
Display the polygon. The external boundaries create two nonintersecting regions and the internal boundary creates a hole.
figure
mapshow(x3,y3,'DisplayType','polygon')
Polygons Using Geographic Coordinates
In general, you can use geographic coordinates when you define polygons over small regions and call functions such as ispolycw. This is true except in cases where the polygon wraps a pole or crosses the Antimeridian.
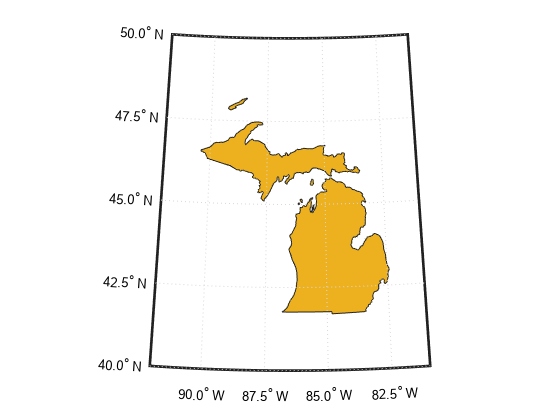
For example, display the state of Michigan on a map using polygons with geographic coordinates. First, read the vertices of the state boundaries.
states = shaperead('usastatehi.shp','UseGeoCoords',true);
michigan = states(22);
lat = michigan.Lat;
lon = michigan.Lon;
Count the boundaries and verify their vertex order. To use ispolycw with geographic coordinates, list the longitude vector as the first argument and the latitude vector as the second argument. The 1-by-6 output array means there are six boundaries. Each element of the array is 1, which means that each boundary is the exterior boundary of its own region.
ispolycw(lon,lat)
ans = 1×6 logical array

   1   1   1   1   1   1
Display the polygon on a map using the geoshow function, specifying 'DisplayType' as 'polygon'.
usamap 'Michigan'
geoshow(lat,lon,'DisplayType','polygon')
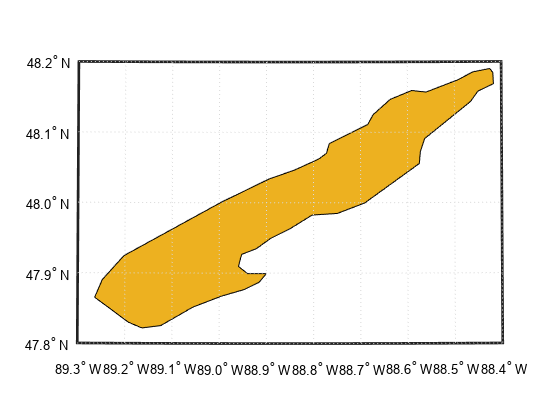
Clip the polygon to the latitude and longitude limits of Isle Royale National Park using the maptrimp function. Display the clipped polygon on a new map.
latlim = [47.8 48.2];
lonlim = [-89.3 -88.4];
[latT,lonT] = maptrimp(lat,lon,latlim,lonlim);

figure
usamap(latlim,lonlim)
geoshow(latT,lonT,'DisplayType','polygon')
Filled Region of Polygons Using Geographic Coordinates
When you display a polygon on the Earth, the boundary divides the Earth into two regions. Both of these regions have finite area, so either could be the inside region of the polygon.
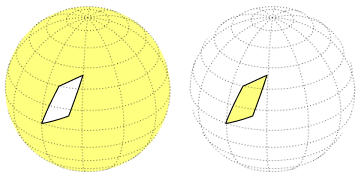
As a result, when you project the vertices of a polygon onto a map using the geoshow function, the filled region may be different than you expect. Change which region is filled by reversing the order of the vertices.
For example, display a small polygon on a world map.
lat2 = [0 10 40 30 0];
lon2 = [0 20 30 10 0];

figure
worldmap('world')
geoshow(lat2,lon2,'DisplayType','polygon')
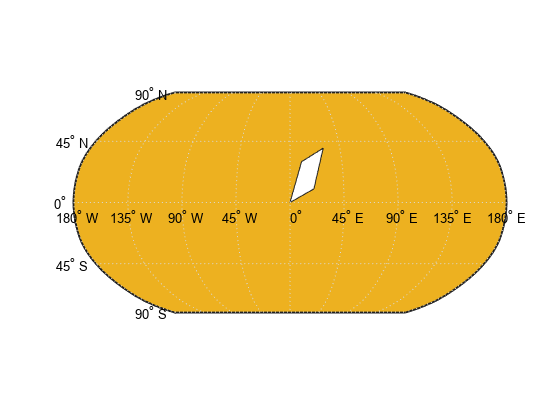
The outside region of the polygon is filled. Reverse the order of the vertices by applying the flip function to the coordinate vectors. Then, display the polygon again.
lat2f = flip(lat2);
lon2f = flip(lon2);

figure
worldmap('world')
geoshow(lat2f,lon2f,'DisplayType','polygon')
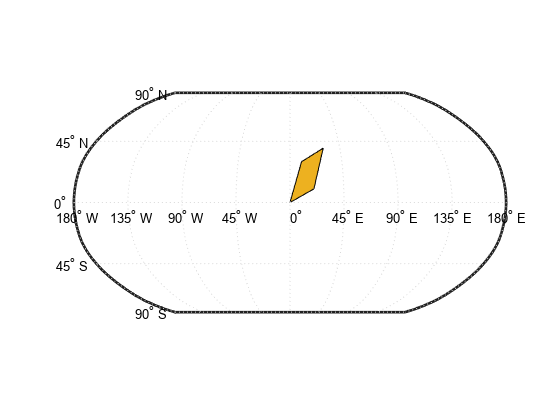
The inside region of the polygon is filled instead.