Transform Coordinates to a Different Projected CRS
If you directly compare data sets with different projected coordinate reference systems (CRSs), then the results are inaccurate. Therefore, before comparing data sets, first verify that the CRSs are the same. If different projected CRSs have the same underlying geographic CRS, then you can transform the coordinates from one projected CRS to the other. Once the data sets are referenced to the same projected CRS, you can compare them.
To transform projected x-y coordinates to a different projected CRS, first unproject the x-y coordinates to latitude-longitude coordinates by using the projinv
function. Then, project the latitude-longitude coordinates to x-y coordinates in a different projected CRS by using the projfwd
function.
For example, import a shapefile containing the x- and y-coordinates of roads in Boston. Also import information about the shapefile as a structure. Find the projected CRS for the coordinates by accessing the CoordinateReferenceSystem
field of that structure.
s = shaperead('boston_roads.shp'); x1 = [s.X]; y1 = [s.Y]; info = shapeinfo('boston_roads.shp'); p1 = info.CoordinateReferenceSystem;
Unproject the x-y coordinates and return latitude-longitude coordinates.
[lat,lon] = projinv(p1,x1,y1);
Select a new projected CRS for the target projection. For this example, create a projcrs
object for UTM zone 19N. Verify that both projected CRSs have the same geographic CRS. If the geographic CRSs are different, then the projected coordinates may be inaccurate. You can find the geographic CRS by querying the GeographicCRS
property of the projcrs
object.
p2 = projcrs(26919); p2.GeographicCRS.Name
ans = "NAD83"
p1.GeographicCRS.Name
ans = "NAD83"
Project the latitude-longitude coordinates to x-y coordinates by specifying the projcrs
object you created.
[x2,y2] = projfwd(p2,lat,lon);
Compare the original x-y coordinates with the new x-y coordinates by displaying them. Add labels and a title to each figure.
figure mapshow(x1,y1) xlabel('x (meters)') ylabel('y (meters)') title(p1.Name)
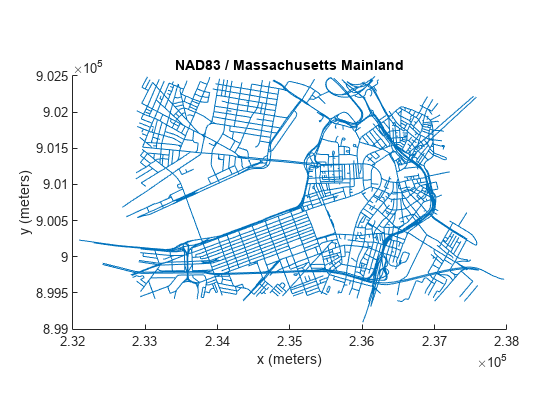
figure mapshow(x2,y2) xlabel('x (meters)') ylabel('y (meters)') title(p2.Name)
The visualizations are similar, but the coordinates displayed along the axis rulers correspond to different projected CRSs.
See Also
projinv
| projfwd
| geocrs
| projcrs
| shaperead