Configure Observability in MATLAB Online Server
Observability is the ability to get an accurate understanding of the current state of a server by monitoring and analyzing server metrics. MATLAB® Online Server™ provides access to third-party observability tools that you can use to diagnose issues with the server and optimize its performance.
Prometheus — A monitoring system that gathers MATLAB Online Server metrics such as network traffic, pod status, and CPU, file system, and memory usage within the Kubernetes® cluster.
Grafana — A dashboard web application that visualizes the server metrics gathered by Prometheus® and provides usage analysis and alerting tools.
You can deploy these tools when installing MATLAB Online Server or deploy them on an already running MATLAB Online Server instance.
Enable Observability During Installation
You can enable Prometheus metrics and the Grafana® dashboard app after downloading the MATLAB
Online Server package and unzipping it but before running the installation commands. In
your MATLAB
Online Server root folder, open the install.config file and set the
DEPLOY_DASHBOARDS property to true.
DEPLOY_DASHBOARDS=trueThen, set any additional properties required for your server and follow the
installation procedure for your environment (see Installation). With the
DEPLOY_DASHBOARDS property enabled, the server enables the
observability tools during installation.
Enable Observability on Existing Server
To enable observability in a MATLAB Online Server instance that is already running, first undeploy the server.
./mosadm undeployThen, in your MATLAB
Online Server root folder, open the install.config file and set the
DEPLOY_DASHBOARDS property to true.
DEPLOY_DASHBOARDS=trueAfter setting this property, copy the Helm® charts used to deploy these dashboards into your MATLAB
Online Server instance. Use the mosadm
copy-helm-charts command to copy all Helm charts used to configure the server, including the
prometheus and grafana charts.
sudo ./mosadm copy-helm-chartsPulling prometheus chart Successfully pulled chart: prometheus Pulling grafana chart Successfully pulled chart: grafana
Generate the YAML override files (prometheus.yaml and
grafana.yaml) used to configure observability. Use the
mosadm generate-overrides command to generate these
files.
Caution
mosadm generate-overrides overwrites any existing overrides
that you customized previously and saves them to a backup folder. To restore
previously customized override files, copy the backup YAML files from the
serverRoot/overrides/cluster/namespace-timestampserverRoot/overrides/cluster/namespace
serverRootclusternamespacetimestamp
sudo ./mosadm generate-overridesGenerating file .../prometheus.yaml Generating file .../grafana.yaml ...
Deploy the server using the mosadm
deploy command. The output of this command displays instructions for
accessing the Prometheus and Grafana applications.
./mosadm deploySample Prometheus output:
Get the Prometheus server URL by running these commands in the same shell:
...
Sample Grafana output:
1. Get your 'admin' user password by running:
...
Access Observability Data
To view the Grafana dashboards for your server instance, go to the
domainBase/grafanadomainBaseDOMAIN_BASE property set in the install.config
file. For example:
matlab.example.com/grafanaUse the instructions output by mosadm deploy to get a username
and password for this page, then log in.
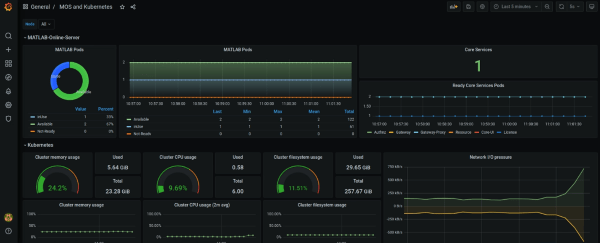
After you log in, click General to view the default dashboards.
MOS and Kubernetes — Provides visualizations of CPU, memory, and file system usage across all pods in the MATLAB Online Server Kubernetes cluster.
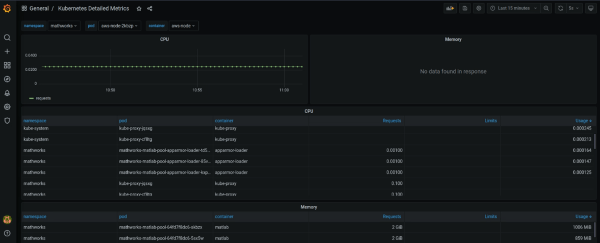
Kubernetes Detailed Metrics — Provides tables containing detailed usage information on pods in the MATLAB Online Server Kubernetes cluster.
For more details on adding new dashboards and analyzing dashboard data, see the Grafana documentation.
To access the Prometheus server, such as to connect the server metrics to a different dashboard
application, follow the instructions output by the mosadm deploy
command. You can also use these instructions to access the
AlertManager and PushGateway
Prometheus applications.
Customize Observability Settings
When you enable observability, MATLAB Online Server uses the default settings from Prometheus and Grafana. To customize your Prometheus and Grafana configurations, modify the fields in these YAML override files:
<server-root>/overrides/<cluster-name>/<namespace-name>/prometheus.yaml
<server-root>/overrides/<cluster-name>/<namespace-name>/grafana.yaml
Here:
<server-root>is the root folder of your MATLAB Online Server installation. Example:matlab_online_server.<cluster-name>is the name of your Kubernetes cluster. Example:matlab-online-server.<namespace-name>is the Kubernetes namespace you used to deploy MATLAB Online Server. Example:mathworks.
For example:
~/matlab_online_server/overrides/matlab-online-server/mathworks/prometheus.yaml
~/matlab_online_server/overrides/matlab-online-server/mathworks/grafana.yaml
You can use these files to enable persistence for the Prometheus and Grafana servers and customize the default dashboards. For details on customizing these settings, see the Prometheus and Grafana documentation.
Disable Observability
To disable observability in MATLAB
Online Server, in the install.config file for your server, set the
DEPLOY_DASHBOARDS property to false.
DEPLOY_DASHBOARDS=falseThen, delete the prometheus.yaml and
grafana.yaml override files located here:
<server-root>/overrides/<cluster-name>/<namespace-name>/prometheus.yaml
<server-root>/overrides/<cluster-name>/<namespace-name>/grafana.yaml