向图中添加注解
注解是添加到图中的额外信息,用来帮助标识一些重要信息。此示例首先解释不同类型的注解,然后说明如何向图中添加圆圈和文本箭头。
注解的类型
使用 annotation 函数可以向图中添加注解。函数的第一个输入指定要创建的注解的类型。
如果将类型指定为
'line'、'arrow'、'doublearrow'或'textarrow',则第二个输入是注解的起点和终点 x 位置。第三个输入是注解的起点和终点 y 位置。例如,annotation('line',[x_begin x_end],[y_begin y_end])。如果将类型指定为
'rectangle'、'ellipse'或'textbox',则第二个参量是位置和大小。例如,annotation('rectangle',[x y w h])。
注解使用归一化的图窗单位,并且可以在一个图窗中跨越多个坐标区。
创建简单的图
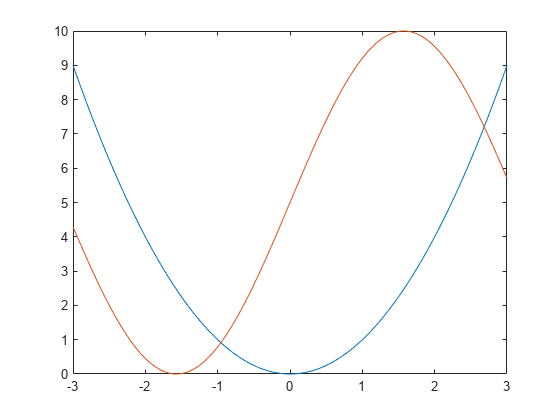
定义和绘制函数 f(x) 和 g(x)。
x = -3.0:0.01:3.0;
f = x.^2;
g = 5*sin(x) + 5;

figure
plot(x,f)
hold on
plot(x,g)
hold off
圆圈注解
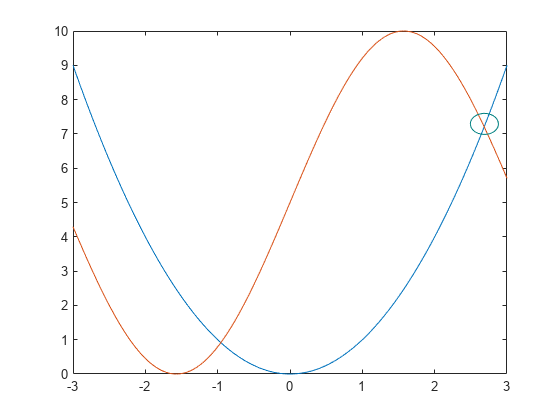
在图中添加一个圆圈,以突出显示 f(x) 等于 g(x) 的位置。要创建圆圈,请使用 'ellipse' 选项作为注解类型。
通过设置底层对象的属性来自定义圆圈。将 Ellipse 对象作为 annotation 函数的输出参量返回。然后,使用圆点表示法访问对象的属性。例如,设置 Color 属性。
elps = annotation('ellipse',[.84 .68 .05 .05])elps =
Ellipse with properties:
Color: [0.1294 0.1294 0.1294]
FaceColor: 'none'
LineStyle: '-'
LineWidth: 0.5000
Position: [0.8400 0.6800 0.0500 0.0500]
Units: 'normalized'
Show all properties
elps.Color = [0 0.5 0.5];
文本箭头注解
使用 'textarrow' 选项作为注解类型,向图中添加一个文本箭头。
您可以通过设置底层对象的属性来自定义文本箭头。将 TextArrow 对象作为 annotation 函数的输出参量返回。然后,使用圆点表示法访问对象的属性。例如,将 String 属性设置为所需的文本,将 Color 属性设置为颜色值。
ta = annotation('textarrow', [0.76 0.83], [0.71 0.71])ta =
TextArrow with properties:
String: {''}
FontName: 'Helvetica'
FontSize: 10
Color: [0.1294 0.1294 0.1294]
TextColor: [0.1294 0.1294 0.1294]
LineStyle: '-'
LineWidth: 0.5000
HeadStyle: 'vback2'
Position: [0.7600 0.7100 0.0700 0]
Units: 'normalized'
X: [0.7600 0.8300]
Y: [0.7100 0.7100]
Show all properties
ta.String = 'f(x) = g(x) ';
ta.Color = [0 0.5 0.5]; 