控制颜色图范围
对于您创建的许多类型的可视化图形,MATLAB® 默认将完整的数据范围映射到颜色图上。数据中的最小值映射到颜色图中的第一行,最大值映射到颜色图中的最后一行。所有中间值线性映射到颜色图的中间行。
这种默认映射适用于大部分情况,但您也可以对选定的任意范围进行映射,即便您选择的范围不同于数据的范围也可以。通过选择不同的映射范围可以执行以下操作:
查看有哪些数据刚好处于指定的范围边界或超出指定的范围。
查看您的数据落在指定范围的哪个位置。
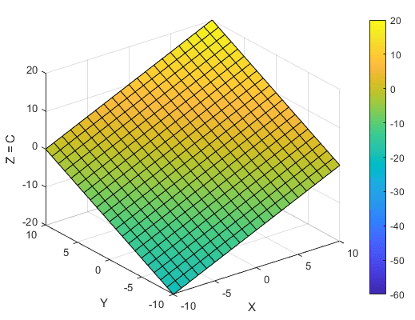
假设曲面 Z = X + Y,其中 -10≤ x ≤10,-10≤ y ≤10。
[X,Y] = meshgrid(-10:10);
Z = X + Y;
s = surf(X,Y,Z);
xlabel('X');
ylabel('Y');
zlabel('Z = C');
colorbar
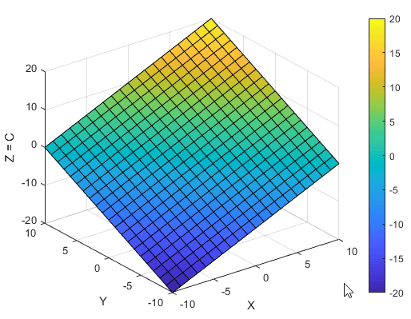
曲面绘图数据与颜色图的关系描述了控制此演示中颜色的属性。实质上,Surface 对象的 CData 属性包含一个数组 C,该数组将曲面上的每个网格点与颜色图中的一种颜色建立关联。默认情况下,C 等于 Z,其中 Z 是在网格点处包含 z = f(x,y) 值的数组。因此,这些颜色随 Z 的变化而变化。
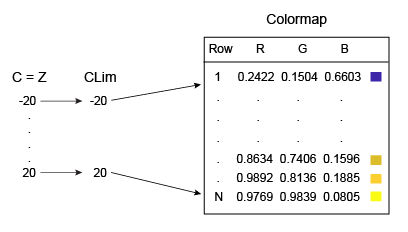
映射范围由 Axes 对象的 CLim 属性控制。此属性包含 [cmin cmax] 形式的二元素向量。cmin 的默认值等于 C 的最小值,cmax 的默认值等于 C 的最大值。在本例中,CLim 为 [-20 20],因为 C 的范围反映 Z 的范围。
将 CLim 更改为 [0 20] 会将 0 处以及其下的所有值统一映射为颜色图中的第一种颜色。
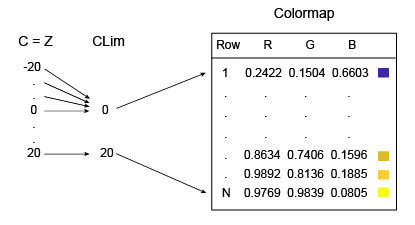
clim 函数将 CLim 属性更改为 [0 20]。注意,曲面的下半部分映射到颜色图中的第一种颜色(深蓝色)。之所以进行这种裁剪,是因为 C(等于 Z)在这些点处的值小于或等于 0。
clim([0 20])
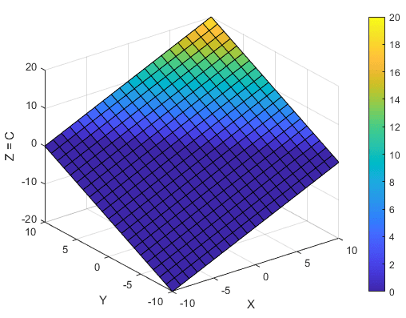
在 R2022a 之前的版本中: 使用 caxis([0 20]) 更改颜色图范围。
您也可以拓宽映射范围,以查看数据在范围中所处的位置。例如,将范围更改为 [-60 20] 将得到仅使用一半颜色的曲面。颜色图的下半部分对应于 C 范围之外的值,因此曲面上不呈现这些颜色。
clim([-60 20])
在 R2022a 之前的版本中: 使用 caxis([-60 20]) 更改颜色图范围。
注意
您可以为曲面绘图、补片、图像或任何使用颜色图的图形对象设置 CLim 属性。但是,此属性仅影响 CDataMapping 属性设置为 'scaled' 的图形对象。如果 CDataMapping 属性设置为 'direct',则 C 索引的所有值将直接映射到颜色图,而不会进行任何缩放。C 的任何小于 1 的值将裁剪映射至颜色图中的第一种颜色。C 的任何大于颜色图长度的值则裁剪映射至颜色图中的最后一种颜色。
另请参阅
clim | colormap | colorbar | surf