叠加阶梯图和线图
此示例演示如何在阶梯图上叠加线图。
定义要绘图的数据。
alpha = 0.01;
beta = 0.5;
t = 0:10;
f = exp(-alpha*t).*sin(beta*t);
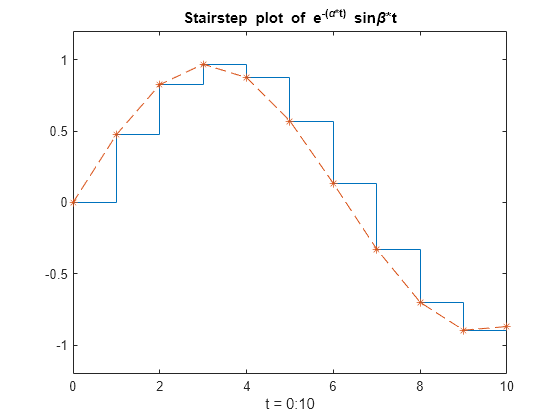
将 f 显示为阶梯图。使用 hold 函数保留阶梯图。使用带有星形标记的虚线添加 f 线图。
stairs(t,f)
hold on
plot(t,f,'--*')
hold off
使用 axis 函数设置坐标轴范围。标记 x 轴并向图形添加一个标题。
axis([0,10,-1.2,1.2])
xlabel('t = 0:10')
title('Stairstep plot of e^{-(\alpha*t)} sin\beta*t')