创建常见的二维图
以下示例演示如何在 MATLAB® 中创建各种二维图。
线图
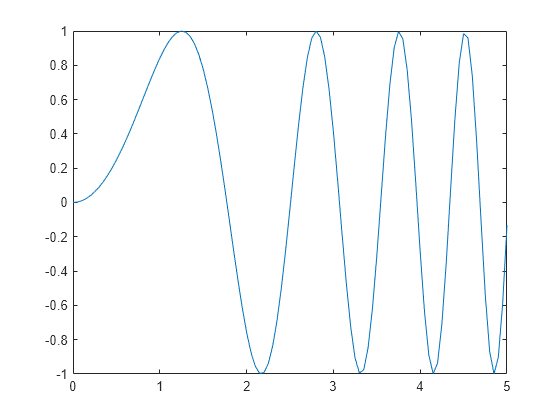
plot 函数用来创建 x 和 y 值的简单线图。
x = 0:0.05:5;
y = sin(x.^2);
figure
plot(x,y)
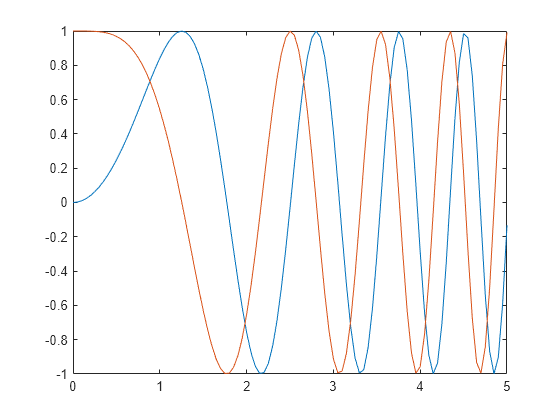
线图可显示多组 x 和 y 数据。
y1 = sin(x.^2);
y2 = cos(x.^2);
plot(x,y1,x,y2)
条形图
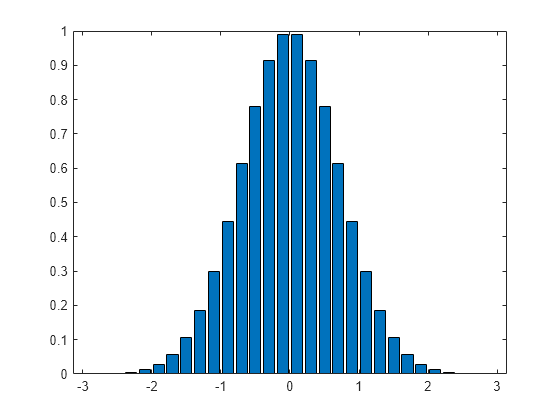
bar 函数用来创建垂直条形图。barh 函数用来创建水平条形图。
x = -2.9:0.2:2.9;
y = exp(-x.*x);
bar(x,y)
阶梯图
stairs 函数用来创建阶梯图。它可以创建仅含 Y 值的阶梯图,或同时包含 x 和 y 值的阶梯图。
x = 0:0.25:10;
y = sin(x);
stairs(x,y)

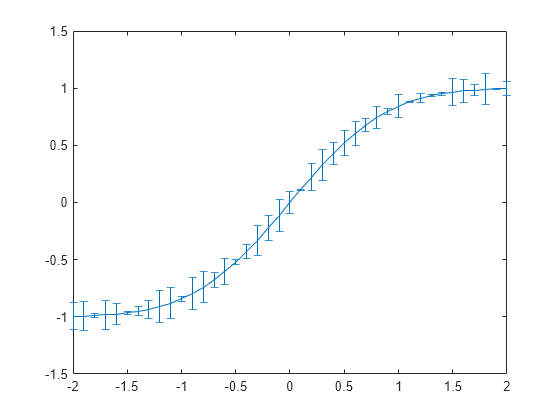
误差条形图
errorbar 函数用来绘制 x 和 y 值的线图并在每个观察点上叠加垂直误差条。若要指定误差条的大小,需要向 errorbar 函数传递一个额外的输入参量。
x = -2:0.1:2;
y = erf(x);
eb = rand(size(x))/7;
errorbar(x,y,eb)
极坐标图
polarplot 函数用来绘制 theta 中的角度值(以弧度为单位)对 rho 中的半径值的极坐标图。
theta = 0:0.01:2*pi;
rho = abs(sin(2*theta).*cos(2*theta));
polarplot(theta,rho)

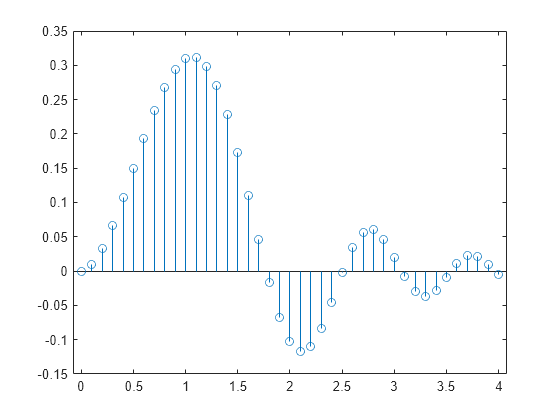
针状图
stem 函数为每个通过竖线连接到一条公共基线的 x 和 y 值绘制一个标记。
x = 0:0.1:4;
y = sin(x.^2).*exp(-x);
stem(x,y)
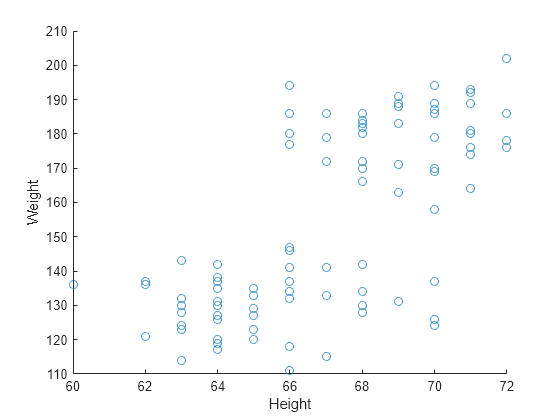
散点图
scatter 函数用来绘制 x 和 y 值的散点图。
load patients Height Weight Systolic
scatter(Height,Weight)
xlabel('Height')
ylabel('Weight')
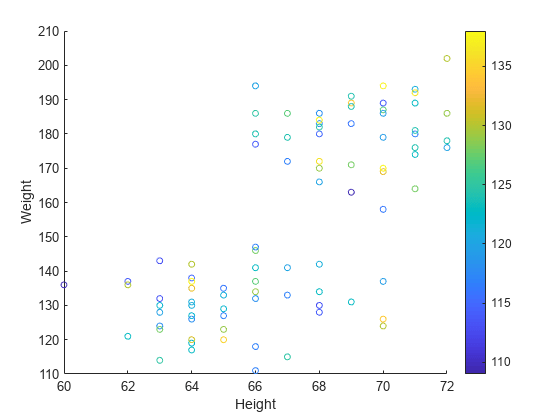
使用 scatter 函数的可选参量指定标记的大小和颜色。使用 colorbar 函数显示当前坐标区上的色阶。
scatter(Height,Weight,20,Systolic)
xlabel('Height')
ylabel('Weight')
colorbar