导出图窗以用于其他应用程序
要导出图窗和绘图以用于文档和其他应用程序,请使用 exportgraphics 函数将内容保存到文件中,或使用 copygraphics 函数将内容复制到剪贴板。这两个函数都使您能够以适合您的应用程序的大小、分辨率和纵横比捕获图窗和绘图。您还可以指定填充边距、背景颜色并控制坐标区刻度位置。本主题中的示例使用 exportgraphics 函数,但您可以在使用 copygraphics 函数时应用相同的概念和参量。
在使用 exportgraphics 和 copygraphics 函数时,保存的内容将不包括与绘图相邻的 UI 组件和容器(如面板)。对于这些情况,请改用 exportapp 函数。
指定要导出的图形
要将绘图导出到文件,请使用 exportgraphics 函数。将父图窗指定为第一个参量。例如,创建一个大小为 535×325 像素的图窗。然后创建一个等高线图并将图窗导出为 PNG 文件。指定图窗使您能够捕获以图窗为直接父级的所有坐标区对象及其内容。如果图窗包括注解,exportgraphics 还会捕获注解。
f = figure;
f.Position(3:4) = [535 325];
contour(peaks)
colorbar
exportgraphics(f,"contour.png")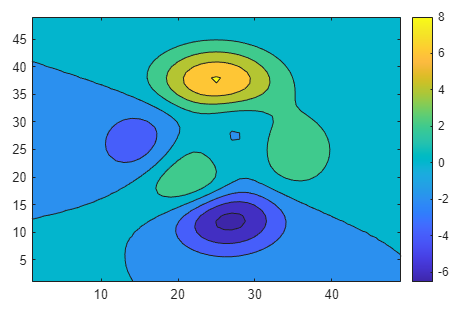
或者,您也可以指定坐标区对象(而不是图窗)作为 exportgraphics 函数的第一个参量。在这种情况下,生成的文件是相同的,因为图窗仅包含一个坐标区对象。
ax = gca;
exportgraphics(ax,"contour.png")
您还可以通过将 TiledChartLayout 对象作为第一个参量进行传递来导出分块图。例如,创建一个包含两个绘图的分块图并将分块图布局导出为 PNG 文件。
f = figure;
f.Position(3:4) = [650 300];
t = tiledlayout(1,2);
ax1 = nexttile;
plot([4 3 2; 3 2 1],LineWidth=2)
ax2 = nexttile;
contourf(peaks)
exportgraphics(t,"twoplots.png")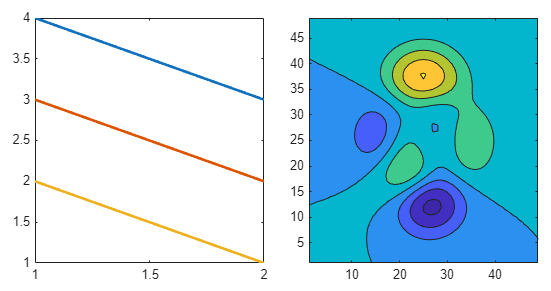
要从分块图布局导出一个绘图,请使用 nexttile 函数获取坐标区对象并将其传递给 exportgraphics 函数。例如,nexttile(2) 返回第二个图块中的坐标区。
ax = nexttile(2);
exportgraphics(ax,"secondplot.png")
指定分辨率
要以特定分辨率将绘图导出为图像,请使用 exportgraphics 函数和 Resolution 名称-值参量。默认情况下,图像以每英寸 150 点 (DPI) 的分辨率保存。
打印输出的常见分辨率为 300 DPI。对于 Web 上的图形,典型分辨率为 72 DPI。要使用与 MATLAB® 所用的相同分辨率导出绘图,请使用图形根 (groot) 对象的 ScreenPixelsPerInch 属性的值。无论您指定的分辨率如何,最终图像的像素维度大约为图窗的宽度和高度乘以分辨率。例如,以 300 DPI 导出 4 英寸宽的绘图将生成宽度为 1200 个像素的图像。
例如,创建一个大小为 535×325 像素的图窗。然后创建一个条形图并使用与 MATLAB 所用的相同分辨率导出图。
f = figure;
f.Position(3:4) = [535 325];
bar([1 11 7 8 2 2 9 3 6])
sppi = get(groot,"ScreenPixelsPerInch");
exportgraphics(f,"barchart.png",Resolution=sppi)

您可以通过指定分辨率以及宽度和高度来导出特定大小的绘图。例如,以下代码将一个图窗的内容保存为一个 300 DPI、边长为 3 英寸(即 900 个像素)的正方形图像。以下各节提供了有关指定宽度和高度的更多详细信息。
exportgraphics(gcf,"bar-3inch-300dpi.png",Units="inches", ...
       Width=3,Height=3,Resolution=300)
指定大小
exportgraphics 函数有四个名称-值参量,在您导出绘图时可以使用它们来控制维度和纵横比:Width、Height、Units 和 PreserveAspectRatio。
控制输出文件大小的一个简单方法是使用 Width 或 Height 名称-值参量指定一个维度的长度。MATLAB 会调整您未指定的维度以保持原始纵横比。当您指定 Width 或 Height 值时,需要指定 Units 名称-值参量。
当您指定大小时,还需要调整图窗的 Position 属性,使图窗的宽度和高度与导出文件的所需宽度和高度相似。Position 属性是一个四元素向量。宽度和高度值是该向量的最后两个元素(默认以像素为单位)。在调用 exportgraphics 之前进行此调整。
例如,创建一个大小为 535×325 像素的图窗。创建一个条形图并将其保存为宽度大约为 500 个像素的 PNG 文件。MATLAB 会将高度调整为 334 个像素以保持原始纵横比。默认情况下,系统会围绕坐标区精确裁剪内容。图像周围的灰色边框勾勒出捕获区域的轮廓。边框不是已保存图像的一部分。
f = figure;
f.Position(3:4) = [535 325];
bar([1 11 7 8 2 2 9 3 6])
exportgraphics(f,"bar500.png",Units="pixels",Width=500)

您还可以同时指定 Width 和 Height 值。以下代码会更改纵横比以创建一个精确裁剪的正方形图像。
exportgraphics(f,"barsquare.png", ...
        Units="pixels",Width=400,Height=400)

如果要保留图的原始纵横比,请将 PreserveAspectRatio 名称-值参量指定为 "on"。以下代码会创建一个正方形图像,包含填充以保留条形图的原始纵横比。
exportgraphics(f,"barsquare-padded.png", ...
        Units="pixels",Width=400,Height=400,PreserveAspectRatio="on")

如果您导出图像文件并使用非像素单位(如英寸或厘米)指定宽度或高度,请确保指定 Resolution 名称-值参量。否则,输出将具有 150 DPI 的默认分辨率,这可能导致与应用程序所需的大小不同。
例如,创建一个条形图并使用与 MATLAB 所用的相同分辨率将其保存为一个边长为 3 英寸的正方形图像。
f = figure;
f.Position(3:4) = [300 300];
bar([1 11 7 8 2 2 9 3 6])
sppi = get(groot,"ScreenPixelsPerInch");
exportgraphics(f,"bar3inchsquare.png", ...
        Units="inches",Width=3,Height=3, ...
        Resolution=sppi)

另一种控制大小的方法是将内容另存为矢量图文件。然后,您可以在您的最终应用程序中调整内容大小。要将内容保存为一个矢量图文件,请使用 exportgraphics 函数并将 ContentType 名称-值参量指定为 "vector"。例如,创建一个条形图窗并将图窗保存为一个包含矢量图的 PDF 片段。所有字体都包含在该 PDF 文件中。输出文件看起来与此图像相似。
f = figure;
f.Position(3:4) = [535 325];
bar([1 11 7 8 2 2 9 3 6])
exportgraphics(f,"bar.pdf",ContentType="vector")

您还可以将图窗导出为 SVG 文件。SVG 文件始终包含矢量图,因此您无需指定 ContentType 值。
exportgraphics(f,"bar.svg")指定填充
您可以通过使用 exportgraphics 与 Padding 名称-值参量来控制导出图周围的填充量。默认情况下,Padding 值为 "tight"。此值提供最小的填充(除非您在 PreserveAspectRatio 值为 "on" 的情况下指定了 Width 和 Height 值)。
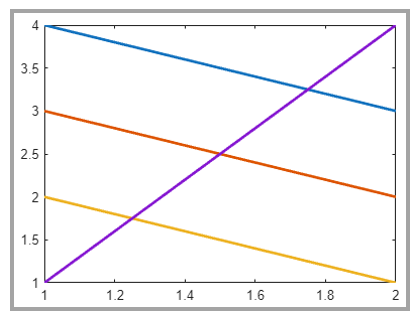
例如,创建一个线图并使用默认填充将其导出为 400×300 像素的 JPG 文件。图像周围的灰色边框勾勒出捕获区域的轮廓。边框不是已保存图像的一部分。
f = figure;
f.Position(3:4) = [400 300];
plot([4 3 2 1; 3 2 1 4],LineWidth=2)
exportgraphics(f,"plot-tight-padding.jpg", ...
       Units="pixels",Width=400,Height=300)
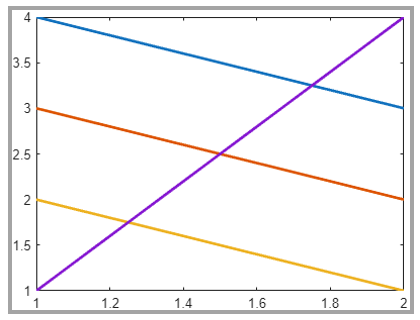
要使用与图窗中显示相同的填充,请将 Padding 名称-值参量指定为 "figure"。填充包含在您指定的维度中。因此,导出的图会小一些,以容纳额外的填充。
exportgraphics(f,"plot-figure-padding.jpg", ...
       Units="pixels",Width=400,Height=300, ...
       Padding="figure")
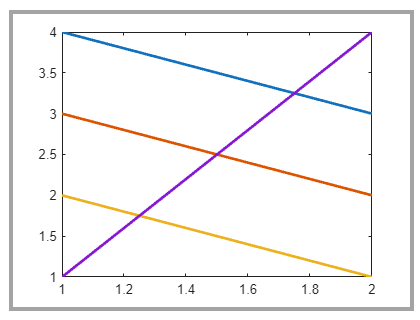
要指定自定义填充值,请将 Padding 名称-值参量指定为与 Width 和 Height 值具有相同单位的数值。在本例中,向图的每侧添加 10 个像素。
exportgraphics(f,"plot-10px-padding.jpg", ...
       Units="pixels",Width=400,Height=300, ...
       Padding=10)
指定背景色
默认情况下,exportgraphics 函数保存的内容具有与图窗主题对应的背景颜色。您可以通过将 BackgroundColor 名称-值参量设置为以下值之一来指定不同背景:
"current"- 根据坐标区父容器(例如图窗或面板)的颜色选择一种颜色。如果图窗的主题是浅色,则背景颜色为白色。如果主题是深色,则背景颜色为深灰色(近乎黑色)。如果父容器具有您设置的自定义颜色,则背景颜色与自定义颜色匹配。"none"- 根据ContentType的值将背景颜色设置为透明、白色或深灰色(近乎黑色):当
ContentType="vector"时,背景颜色为透明。当
ContentType="image"时,浅色主题的图窗的背景颜色为白色,深色主题的图窗的背景颜色为深灰色(近乎黑色)。
自定义颜色,指定为 RGB 三元组(如
[1 0 0])、十六进制颜色代码(如"#FF0000")或指定颜色(例如"red")。
例如,创建一个针状图,将图窗另存为一个 PDF 文件并使用透明背景。
f = figure;
f.Position(3:4) = [400 300];
stem(1:10,"filled",LineWidth=2)
ylim padded
exportgraphics(f,"stem-transparent.pdf",ContentType="vector",...
               BackgroundColor="none")

保留坐标区范围和刻度值
有时,exportgraphics 函数会根据输出的字体大小和纵横比以不同坐标区范围或刻度值捕获您的内容。要防止更改坐标区范围和刻度值,请将坐标区的刻度值模式和范围模式属性设置为 "manual"。例如,当绘制到笛卡尔坐标区时,将 XTickMode、YTickMode、ZTickMode、XLimMode、YLimMode 和 ZLimMode 属性设置为 "manual"。
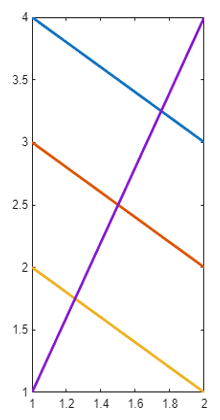
例如,以下代码会创建一个绘图并将模式属性设置为 "manual"。然后,它会以显著不同的纵横比导出该绘图。输出文件会保留坐标区范围和刻度值。
f = figure;
f.Position(3:4) = [400 300];
plot([4 3 2 1; 3 2 1 4],LineWidth=2)

% Set the mode properties of the axes
ax = gca;
ax.XTickMode = "manual";
ax.YTickMode = "manual";
ax.ZTickMode = "manual";
ax.XLimMode = "manual";
ax.YLimMode = "manual";
ax.ZLimMode = "manual";

exportgraphics(f,"eplot-preserveticks.png", ...
       Units="pixels",Width=200,Height=400)
对于极坐标图,将极坐标区的 RTickMode、ThetaTickMode、RLimMode 和 ThetaLimMode 属性设置为 "manual"。