图像数据与颜色图的关系
在使用 image 函数显示图像时,可以控制像素范围值与颜色图范围的映射关系。例如,此处的 5×5 幻方显示为一个使用默认颜色图的图像。
A = magic(5)
A =

    17    24     1     8    15
    23     5     7    14    16
     4     6    13    20    22
    10    12    19    21     3
    11    18    25     2     9
im = image(A);
axis off
colorbar
A 包含介于 1 和 25 之间的值。MATLAB® 将这些值视为指向颜色图(包含 64 个条目)的索引。因此,先前图像中的所有像素映射到该颜色图中的前 25 个条目(大致为颜色栏中的蓝色区域)。
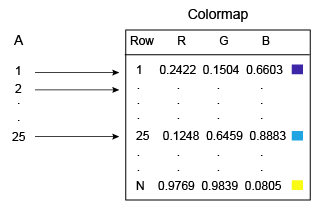
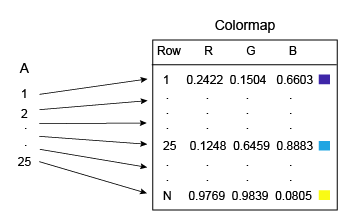
您可以通过 Image 对象的 CDataMapping 属性控制此映射。先前的图中所示的默认行为对应于此属性的 'direct' 选项。在显示包含自带颜色图的图像(例如 GIF 图像)时,直接映射很有用。但是,如果图像表示某些物理单位(例如米或度)的测量值,则可将 CDataMapping 属性设置为 'scaled'。缩放映射使用完整的颜色范围,它允许您以可视化方式显示数据中的相对差异。
im.CDataMapping = 'scaled';
'scaled' 选项可将 A 的最小值映射到颜色图中的第一个条目,将 A 的最大值映射到颜色图中的最后一个条目。A 的所有中间值线性缩放映射至颜色图。
作为设置 CDataMapping 属性为 'scaled' 的一个替代方法,您还可以调用 imagesc 函数以达到相同效果。
imagesc(A)
axis off
colorbar
如果更改颜色图,A 中的值会缩放映射至新颜色图。
colormap(gray)
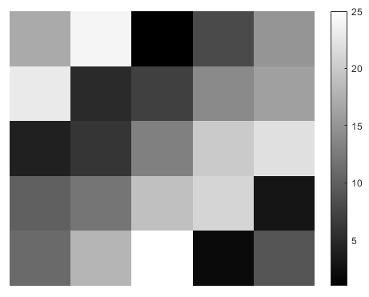
缩放映射也适用于显示不含颜色图的绘画图像,或者您想更改绘画图像的颜色图的情形。以下命令使用 gray 颜色图显示图像,此颜色图不同于此图像中存储的原始颜色图。
load clown
image(X,'CDataMapping','scaled')
colormap(gray)
axis off
colorbar
