Multilevel Default Values
This example sets default values on more than one level in the hierarchy. These statements create two axes in one figure window, setting default values on the figure level and the axes level:
t = 0:pi/20:2*pi;
s = sin(t);
c = cos(t);
figure('defaultAxesPlotBoxAspectRatio',[1 1 1],...
      'defaultAxesPlotBoxAspectRatioMode','manual');
subplot(1,2,1,'defaultLineLineWidth',2);
hold on
plot(t,s,t,c)
text('Position',[3 0.4],'String','Sine')
text('Position',[2 -0.3],'String','Cosine')

subplot(1,2,2,'defaultTextRotation',90);
hold on
plot(t,s,t,c)
text('Position',[3 0.4],'String','Sine')
text('Position',[2 -0.3],'String','Cosine')
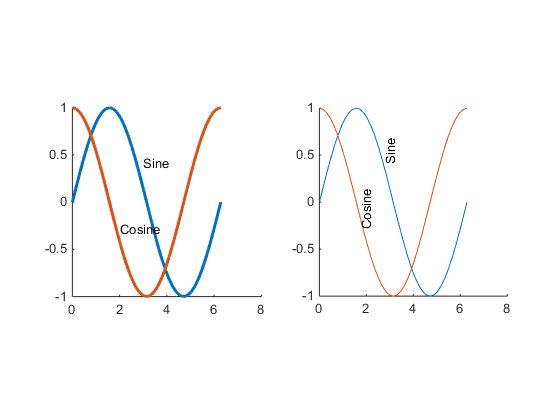
Issuing the same plot and text statements to each subplot region results in a different display,
reflecting different default values defined for the axes. The default defined on the figure
applies to both axes.
It is necessary to call hold
on to prevent the plot function from resetting axes
properties.
Note
If a property has an associated mode property (for example,
PlotBoxAspectRatio and PlotBoxAspectRatioMode), you
must define a default value of manual for the mode property when you
define a default value for the associated property.
You can also select a web site from the following list:
Americas
- América Latina (Español)
- Canada (English)
- United States (English)
Europe
- Belgium (English)
- Denmark (English)
- Deutschland (Deutsch)
- España (Español)
- Finland (English)
- France (Français)
- Ireland (English)
- Italia (Italiano)
- Luxembourg (English)
- Netherlands (English)
- Norway (English)
- Österreich (Deutsch)
- Portugal (English)
- Sweden (English)
- Switzerland
- United Kingdom (English)