Create Live Script with Multiple Interactive Controls
R2026bThis example shows how you can use interactive controls to visualize and investigate patient data in MATLAB. Using a variety of interactive controls, you can filter a list of patients and then plot the age and systolic blood pressure of the filtered list, highlighting the patients over a specified blood pressure.
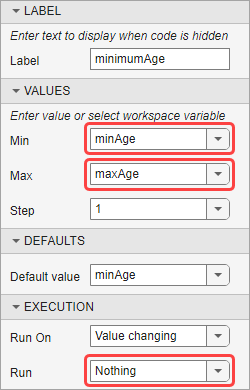
The example uses variables to control the slider and spinner values, as well as the drop-down list items. For instance, to filter the patient list by location, insert a drop-down list and select the locationStrings variable to populate the items in the list. To filter the patient list by age, insert a slider and select the minAge and maxAge variables as the Min and Max values. To specify a threshold systolic blood pressure, insert a spinner and select the minPressure and maxPressure variables as the Min and Max values.
To filter the data only when the Filter Data button is pressed, set the Run execution option for the drop-down list, checkbox, slider, and edit field to Nothing.
To view and interact with the controls, open this example in your browser or in MATLAB.
Get and Filter Sample Patient Data
Use the file browser to select a file containing patient data and then create a table from the patient data. Use the drop-down list, checkbox, slider, and edit field to specify patient filtering information such as location, smoking status, age, and the letters present in the patient last name. Use the Filter Data button to filter the data.
filename ="patients.xls"; T = readtable(filename); locationStrings = ["VA Hospital","County General Hospital","St. Mary's Medical Center"]; selectedLocation =
locationStrings(1); isSmoker =
true; maxAge = max(T.Age); minAge = min(T.Age); minimumAge =
31; nameContains =
"e";
idx = T.Location==selectedLocation & T.Smoker==isSmoker & T.Age>=minimumAge; if ~strcmp(nameContains,"") idx = idx & contains(T.LastName,nameContains); end TFiltered = T(idx,:);
Plot Filtered Patient Data
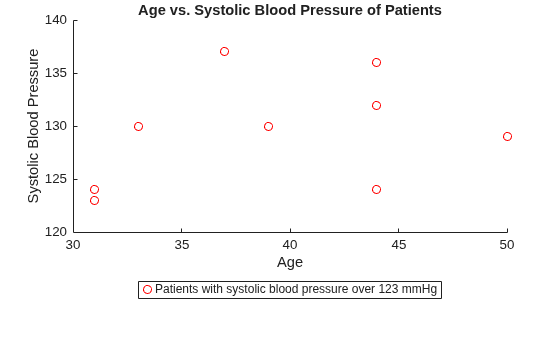
Plot the age and systolic blood pressure of the filtered patient data, highlighting the patients over a specified blood pressure. Use the spinner to specify the threshold blood pressure value.
minPressure = min(TFiltered.Systolic); maxPressure = max(TFiltered.Systolic); thresholdPressure =123; TOverThreshold = TFiltered(TFiltered.Systolic>=thresholdPressure,:); sp1 = scatter(TFiltered.Age,TFiltered.Systolic); hold on sp2 = scatter(TOverThreshold.Age,TOverThreshold.Systolic,"red"); hold off title("Age vs. Systolic Blood Pressure of Patients") xlabel("Age") ylabel("Systolic Blood Pressure") legendText = sprintf("Patients with systolic blood pressure over %d mmHg",thresholdPressure); legend(sp2,legendText,Location="southoutside")