axtoolbarbtn
Add buttons to axes toolbar
Description
btn = axtoolbarbtn(tb)tb and returns the
ToolbarPushButton object.
btn = axtoolbarbtn(tb,style,Name=Value)myfile.svg to the axes toolbar, set
Icon to "myfile.svg".
Examples
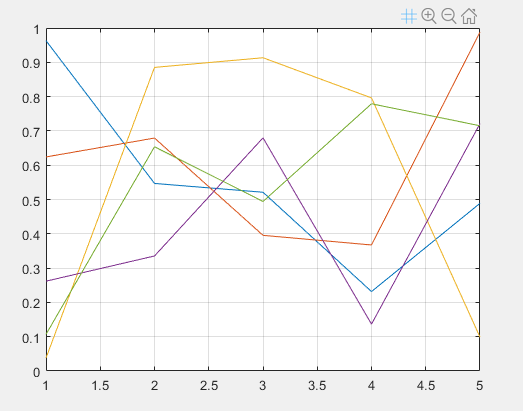
Create a custom state button for the axes toolbar that toggles the visibility of the axes grid lines.
First, create a program file named mycustomstatebutton.m. Within
the program file:
Plot random data.
Create a toolbar for the axes with options to zoom and restore the view using the
axtoolbarfunction.Add an empty state button to the toolbar using the
axtoolbarbtnfunction. Return theToolbarStateButtonobject.Specify the icon, tooltip, and callback function for the state button by setting the
Icon,Tooltip, andValueChangedFcnproperties. This example uses the icon, which you must first save as an image file namedmygridicon.svgon your path.
Run the program file, and click the icon to toggle the visibility of the grid lines.
function mycustomstatebutton

plot(rand(5))
ax = gca;
tb = axtoolbar(ax,{"zoom","restoreview"});

btn = axtoolbarbtn(tb,"state");
btn.Icon = "mygridicon.svg";
btn.Tooltip = "Grid Lines";
btn.ValueChangedFcn = @customcallback;

    function customcallback(src,event)
        switch src.Value
            case "off"
                event.Axes.XGrid = "off";
                event.Axes.YGrid = "off";
            case "on"
                event.Axes.XGrid = "on";
                event.Axes.YGrid = "on";
        end
    end

end
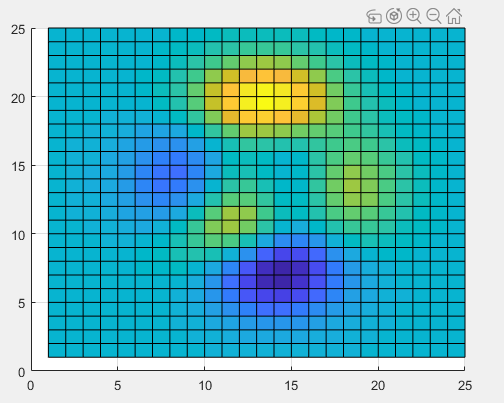
Create a custom push button for the axes toolbar that snaps the view of the axes to a 2-D view.
First, create a program file named mycustompushbutton.m. Within
the program file:
Plot a surface.
Create a toolbar for the axes with options to zoom, rotate, and restore the view using the
axtoolbarfunction.Add an empty push button to the toolbar using the
axtoolbarbtnfunction. Return theToolbarPushButtonobject.Specify the icon, tooltip, and callback function for the push button by setting the
Icon,Tooltip, andButtonPushedFcnproperties, respectively. This example uses the icon, which you must first save as an image file namedmy2dicon.svgon your path.
Run the program file, and click the icon to snap the view of the axes to a 2-D view.
function mycustompushbutton

surf(peaks(25))
ax = gca;
tb = axtoolbar(ax,{"zoom","rotate","restoreview"});

btn = axtoolbarbtn(tb,"push");
btn.Icon = "my2dicon.svg";
btn.Tooltip = "Snap to 2-D view";
btn.ButtonPushedFcn = @customcallback;

    function customcallback(src,event)
        view(event.Axes,2)
    end

end