从您的移动设备获取 GPS 数据,并在地图上绘制您的位置和速度
此示例说明如何从 Android™ 或 iOS 移动设备收集位置数据并将其显示在地图上。纬度和经度坐标用于标记设备的路线。速度信息用于给路线添加颜色。最终结果是设备行程的位置和速度的可视化表示。
此示例需要 Mapping Toolbox™。
设置您的移动设备
为了在 MATLAB® 中接收来自移动设备的数据,您需要在您的移动设备上安装和设置 MATLAB Mobile™ App。
从 MATLAB Mobile 的“设置”登录到 MathWorks® Cloud。
创建与移动设备的连接
在 MATLAB Mobile 的命令屏幕上,使用 mobiledev 命令创建一个表示您的移动设备的对象。
m = mobiledev;
输出应显示 Connected: 1,表明 mobiledev 对象已成功建立与该 App 的连接。
准备从位置传感器获取数据
为了收集 GPS 数据,请首先确保您设备的 GPS 已打开。如果已在移动设备的位置设置上启用了移动网络或 Wi-Fi,也可用它们来确定位置。
在移动设备上启用位置传感器。
m.PositionSensorEnabled = 1;
数据出现在 MATLAB Mobile 的传感器屏幕上可能需要一些时间,因为设备需要搜索 GPS 信号。GPS 信号在室内通常不可用。
开始获取数据
启用传感器后,MATLAB Mobile 的传感器屏幕将显示传感器测量的当前数据。Logging 属性允许您开始向 mobiledev 发送传感器数据。
m.Logging = 1;
收集位置数据
现在 mobiledev 正在记录设备上所记录的所有位置传感器数据。
在此示例中,设备采集的数据来自在 MathWorks 附近的一次短途行驶记录。
停止记录数据
再次使用 mobiledev 的记录属性以停止记录数据。
m.Logging = 0;
检索记录的位置数据
要创建地图,需要纬度、经度和速度数据。poslog 函数可用于从 mobiledev 检索这些信息。
[lat,lon,t,spd] = poslog(m);
对于此示例,系统已记录和保存了数据。
load drivingAroundMathWorks lat lon spd;
将速度划分为以颜色值表示的 bin
对速度值分 bin 以便使用离散数量的颜色来表示观测到的速度。
nBins = 10;
binSpacing = (max(spd) - min(spd))/nBins;
binRanges = min(spd):binSpacing:max(spd)-binSpacing;

% Add an inf to binRanges to enclose the values above the last bin.
binRanges(end+1) = inf;

% |histc| determines which bin each speed value falls into.
[~, spdBins] = histc(spd, binRanges);
按速度拆分纬度和经度数据
为每个速度 bin 创建一个不连续线段。将为每个线段分配一种颜色。相对于将每对相邻的纬度和经度值视为其自己的线段,上述做法创建的总线段数要少得多。
使用 Mapping Toolbox 中的 geoshape 将各线段存储为地理特征。
lat = lat';
lon = lon';
spdBins = spdBins';

% Create a geographical shape vector, which stores the line segments as
% features.
s = geoshape();

for k = 1:nBins

    % Keep only the lat/lon values which match the current bin. Leave the
    % rest as NaN, which are interpreted as breaks in the line segments.
    latValid = nan(1, length(lat));
    latValid(spdBins==k) = lat(spdBins==k);

    lonValid = nan(1, length(lon));
    lonValid(spdBins==k) = lon(spdBins==k);

    % To make the path continuous despite being segmented into different
    % colors, the lat/lon values that occur after transitioning from the
    % current speed bin to another speed bin will need to be kept.
    transitions = [diff(spdBins) 0];
    insertionInd = find(spdBins==k & transitions~=0) + 1;

    % Preallocate space for and insert the extra lat/lon values.
    latSeg = zeros(1, length(latValid) + length(insertionInd));
    latSeg(insertionInd + (0:length(insertionInd)-1)) = lat(insertionInd);
    latSeg(~latSeg) = latValid;

    lonSeg = zeros(1, length(lonValid) + length(insertionInd));
    lonSeg(insertionInd + (0:length(insertionInd)-1)) = lon(insertionInd);
    lonSeg(~lonSeg) = lonValid;

    % Add the lat/lon segments to the geographic shape vector.
    s(k) = geoshape(latSeg, lonSeg);

end
创建 Web 地图和路线叠加
这些线段现在可以组合成一个 Web 地图显示。纬度和经度数据已经过处理,可以以单独的线段形式来叠加在地图上。每个线段都有一种颜色,对应于在相应位置记录的速度。
Mapping Toolbox 提供了许多处理 Web 地图的函数。
使用 webmap 在浏览器中打开一个 Web 地图。
wm = webmap('Open Street Map');作为参考,我们在地图上标记了 MathWorks 的位置。
mwLat = 42.299827;
mwLon = -71.350273;
name = 'MathWorks';
iconDir = fullfile(matlabroot,'toolbox','matlab','icons');
iconFilename = fullfile(iconDir, 'matlabicon.gif');
wmmarker(mwLat, mwLon, 'FeatureName', name, 'Icon', iconFilename);
使用 autumn 颜色图生成与速度 bin 对应的颜色列表。这将为每个 bin 创建一个具有 RGB 值的 [nBins x 3] 矩阵。
colors = autumn(nBins);
使用地理形状向量在 Web 地图上绘制一个线条。该形状向量的每个元素对应于一个分 bin 速度值的非连续线段。这些元素与刚刚创建的颜色列表的元素相匹配。
wmline(s, 'Color', colors, 'Width', 5);
放大地图并聚焦于路线。
wmzoom(16);
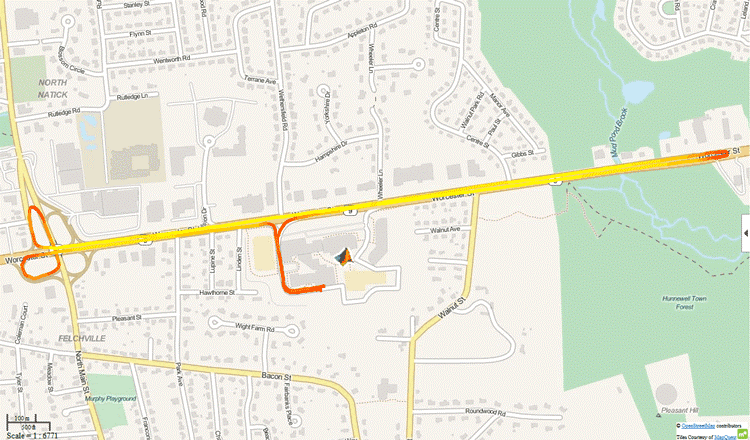
最终显示提供整个路线中位置和速度的可视化表示。显然,在停车场和转弯时,设备的行进速度比在直道上慢。
清理
关闭位置传感器并清理 mobiledev。
m.PositionSensorEnabled = 0;

clear m;
要在桌面 MATLAB 中运行此示例,您必须安装 MATLAB Support Package for Android Sensors 或 MATLAB Support Package for Apple iOS Sensors,具体取决于您所使用的移动设备。