使用 Symbolic Math Toolbox 学习微积分
使用 Symbolic Math Toolbox™ 学习微积分和应用数学。此示例说明入门级函数 fplot、diff 和 int。
要操作变量,请创建一个类型为 syms 的对象。
disp('Create a symbolic variable for x')
disp('>> syms x')
syms x
Create a symbolic variable for x
>> syms x
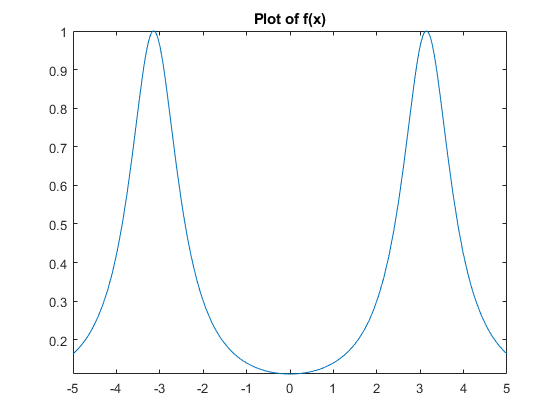
定义符号变量后,您可以使用 fplot 编译和可视化函数。
disp('Build the function f(x) and plot it')
disp('>> f(x) = 1/(5+4*cos(x))')
disp('>> fplot(f)')
f(x) = 1/(5+4*cos(x))
figure;
fplot(f)
title('Plot of f(x)')
Build the function f(x) and plot it
>> f(x) = 1/(5+4*cos(x))
>> fplot(f)

f(x) =

1/(4*cos(x) + 5)
使用数学表示法计算函数在 x = pi/2 处的值。
disp('Evaluate f(x) at x = pi/2')
disp('>> f(pi/2)')
f(pi/2)
Evaluate f(x) at x = pi/2
>> f(pi/2)

ans =

1/5
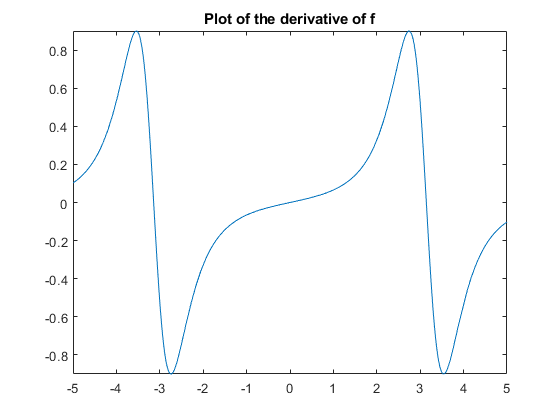
许多函数都可以使用符号变量。例如,函数 diff 对函数求导。
disp('Differentiate f(x) and plot the result')
disp('>> f1 = diff(f)')
disp('>> fplot(f1)')
f1 = diff(f)
figure;
fplot(f1)
title("Plot of the derivative of f")
Differentiate f(x) and plot the result
>> f1 = diff(f)
>> fplot(f1)

f1(x) =

(4*sin(x))/(4*cos(x) + 5)^2
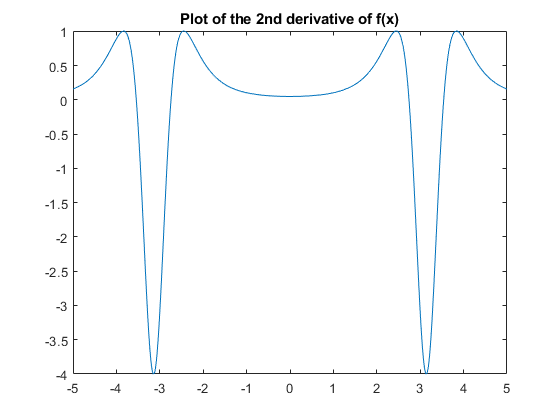
diff 函数还可以求第 N 个导数。以下示例说明二阶导数。
disp('Compute the second derivative of f(x) and plot it')
disp('>> f2 = diff(f,2)')
disp('>> fplot(f2)')
f2 = diff(f,2)
figure;
fplot(f2)
title("Plot of the 2nd derivative of f(x)")
Compute the second derivative of f(x) and plot it
>> f2 = diff(f,2)
>> fplot(f2)

f2(x) =

(4*cos(x))/(4*cos(x) + 5)^2 + (32*sin(x)^2)/(4*cos(x) + 5)^3
int 函数可以对符号变量的函数进行积分。以下示例说明尝试通过对二阶导数进行两次积分来得到原始函数。
disp('Retrieve the original function by integrating the second derivative twice. Plot the result.')
disp('>> g = int(int(f2))')
disp('>> fplot(g)')
g = int(int(f2))
figure;
fplot(g)
title("Plot of int(int(f2))")
Retrieve the original function by integrating the second derivative twice. Plot the result.
>> g = int(int(f2))
>> fplot(g)

g(x) =

-8/(tan(x/2)^2 + 9)

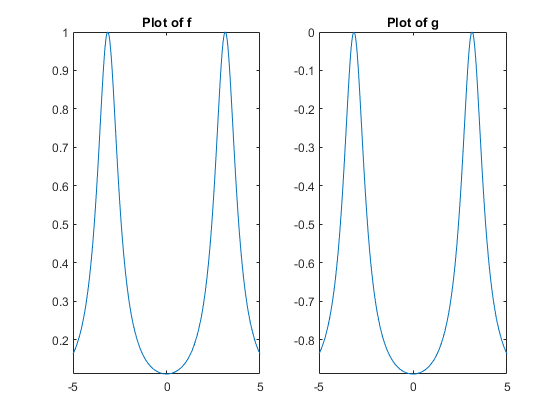
最初,f 和 g 的绘图看起来相同。但是,其公式和 y 轴范围不同。
disp('Observe the formulas and ranges on the y-axis when comparing f and g')
disp('>> subplot(1,2,1)')
disp('>> fplot(f)')
disp('>> subplot(1,2,2)')
disp('>> fplot(g)')
disp(' ')
figure;
subplot(1,2,1)
fplot(f)
title("Plot of f")
subplot(1,2,2)
fplot(g)
title("Plot of g")
Observe the formulas and ranges on the y-axis when comparing f and g
>> subplot(1,2,1)
>> fplot(f)
>> subplot(1,2,2)
>> fplot(g)
值 e 是 f 和 g 之间的差值。它有复杂的公式,但其图形看起来像一个常量。
disp('Compute the difference between f and g')
disp('>> e = f - g')
e = f - g
Compute the difference between f and g
>> e = f - g

e(x) =

8/(tan(x/2)^2 + 9) + 1/(4*cos(x) + 5)
为了显示差值确实是常量,请简化方程。
disp('Simplify the equation to show that the difference between f and g is constant')
disp('>> simplify(e)')
e = simplify(e)
Simplify the equation to show that the difference between f and g is constant
>> simplify(e)

e(x) =

1