创建三维散点图
此示例说明如何在 MATLAB 中创建三维散点图。您可以在 MATLAB 文档中阅读关于 scatter3 函数的内容。
加载关于臭氧水平的数据。
load ozoneData Ozone Temperature WindSpeed SolarRadiation
计算臭氧水平。
z = (Ozone).^(1/3);
response = z;
生成臭氧水平的颜色索引。
nc = 16;
offset = 1;
c = response - min(response);
c = round((nc-1-2*offset)*c/max(c)+1+offset);
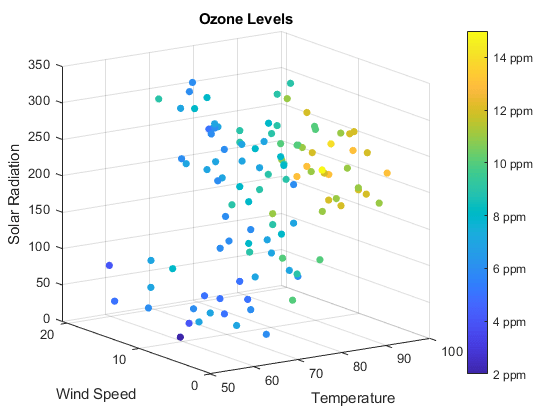
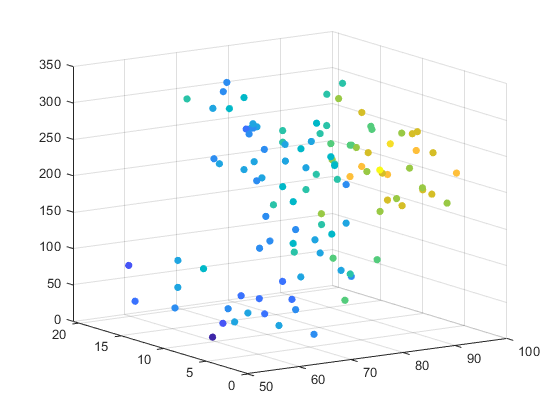
使用 scatter3 函数创建三维散点图。
figure
scatter3(Temperature, WindSpeed, SolarRadiation, 30, c, 'filled')
view(-34, 14)
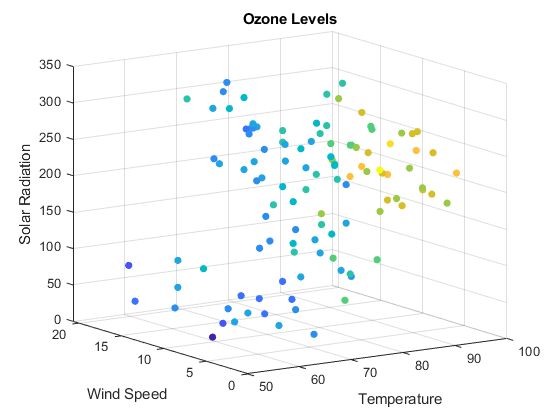
添加标题和轴标签。
title('Ozone Levels')
xlabel('Temperature')
ylabel('Wind Speed')
zlabel('Solar Radiation')
添加一个具有刻度标签的颜色栏。使用省略号“...”将语句延续到下一行。
colorbar('Location', 'EastOutside', 'YTickLabel',...
{'2 ppm', '4 ppm', '6 ppm', '8 ppm', '10 ppm', '12 ppm', '14 ppm'})