Main Content

jitter

Measure jitter metrics from waveforms

Since R2024b

Description

J = jitter(x,y,SymbolTime = t) measures jitter from input jittery waveform by using the specified symbol time.

example

J = jitter(y,SampleInterval = s,SymbolTime = t) measures jitter by using the specified sample interval and symbol time.

J = jitter(x,y,xr,yr) measures jitter from input jittery waveform with respect to the reference waveform.

J = jitter(y,yr,SampleInterval = s) measures jitter with respect to the reference waveform and specified sample interval.

J = jitter(___,Name=Value) measures jitter using name-value arguments. Unspecified arguments take default values.

Examples

collapse all

This example shows how to measure edge jitter in oversampled time-domain waveform data, particularly waveforms produced by sampled data systems.

Load Data

Load the waveform data, including a waveform with jitter (tj, yj) and a reference waveform without jitter (tr, yr), from a file.

load("JitterPAM2.mat", "tj", "yj", "tr", "yr");

Measure Jitter

Use the function jitter() to measure edge jitter in the waveform. Edge jitter characterizes trends in timing error, which is the time difference between any observed edge and the corresponding nominal or reference edge.

J = jitter(tj, yj, tr, yr, "Plot", "on")

Figure contains 7 axes objects. Axes object 1 with title TJ PDF, xlabel Timing Error, ylabel PDF Estimate contains an object of type histogram. Axes object 2 with title RJ PDF, xlabel Timing Error, ylabel PDF Estimate contains an object of type histogram. Axes object 3 with title DJ PDF, xlabel Timing Error, ylabel PDF Estimate contains an object of type histogram. Axes object 4 with title DDJ PDF, xlabel Timing Error, ylabel PDF Estimate contains an object of type histogram. Axes object 5 with title SJ PDF, xlabel Timing Error, ylabel PDF Estimate contains an object of type histogram. Axes object 6 with title DCD PDF, xlabel Timing Error, ylabel PDF Estimate contains an object of type histogram. Axes object 7 with title ISI PDF, xlabel Timing Error, ylabel PDF Estimate contains an object of type histogram.

J = struct with fields:
      TJrms: 4.1554e-10
     TJpkpk: 4.9621e-10
      RJrms: 1.0115e-10
      DJrms: 9.4134e-11
     DJpkpk: 4.7368e-10
     DDJrms: 6.0662e-11
    DDJpkpk: 2.9648e-10
        SJa: 8.6490e-11
        SJf: 1.8311e+05
        SJp: -1.7257
     DCDrms: 5.5722e-11
    DCDpkpk: 1.1144e-10
     ISIrms: 3.3659e-12
    ISIpkpk: 1.8504e-10

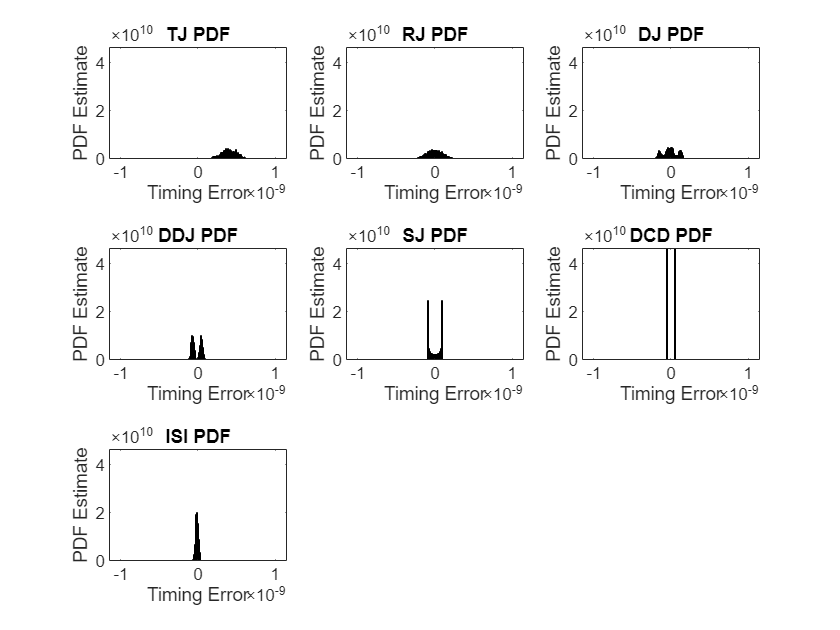
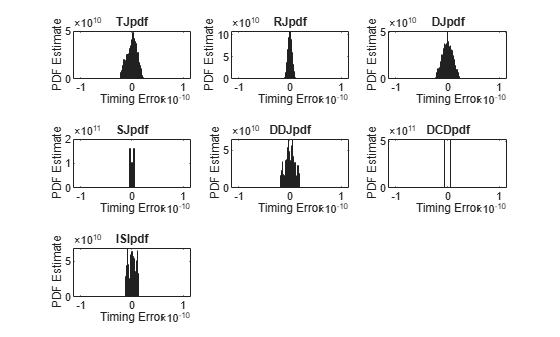
The edge jitter is characterized by the following metrics:

  • TJ (Total Jitter) - Both Root-Mean-Square (RMS) or Peak-to-Peak (Pk-Pk) values are calculated directly from the timing error sequence.

  • DCD (Duty Cycle Distortion) - Odd/even DCD applies one timing offset to edges with odd indices and another to edges with even indices. The Pk-Pk is the difference between the larger and smaller of the two timing offset values.

  • SJ (Sinusoidal Jitter) - This metric captures sinusoidal trends in the timing error sequence. These are reported as the Amplitude (SJa), Frequency (SJf), and Phase (SJp) of a cosine.

  • ISI (Intersymbol Interference) - This metric correlates the jitter at each edge with the pattern before (and after) that edge in time. The result of this correlation is a Dirac delta function for each symbol/delay combination. Groups for each delay are convolved together to produce an estimate of a PDF for ISI. The RMS and Pk-Pk ISI metrics are derived from this PDF.

  • DDJ (Data Dependent Jitter) - The PDF estimate for DDJ is the result of convolution of the ISI and DCD PDF estimates.

  • DJ (Deterministic Jitter) - The PDF estimate for DJ is the result of convolution of the DDJ and SJ PDF estimates.

  • RJ (Random Jitter) - Is the residual jitter remaining in the system after DJ has been compensated. Random Jitter, unlike the other jitter metrics, is assumed to be unbounded and so only its RMS is reported.

Input Arguments

collapse all

Time coordinates of the jittery signal, specified as a monotonically increasing vector.

If you do not provide y, the function interprets x as edge times.

Data Types: double

Amplitude coordinates of the jittery signal, specified as a vector or as an eyeDiagramSI object.

If you do not provide x, the function assumes y is uniformly sampled at the rate specified by SampleInterval.

Data Types: double

Time coordinates of the reference signal, specified as a monotonically increasing vector.

Data Types: double

Amplitude coordinates of the reference signal, specified as a vector. If you do not provide x, yr must be sampled at the same points as y.

Data Types: double

Name-Value Arguments

Specify optional pairs of arguments as Name1=Value1,...,NameN=ValueN, where Name is the argument name and Value is the corresponding value. Name-value arguments must appear after other arguments, but the order of the pairs does not matter.

Example: J = jitter(x,y,SampleInterval = s, Plot = on) calculates and plots the histograms of the jitter metrics from the input waveform defined by (x,y) and sample interval specified by s.

General

collapse all

Thresholds to separate symbol levels in the jittery waveform, specified as a vector. If you do not provide SymbolThresholds, the function calculates it from the histogram of y.

Data Types: double

Thresholds to separate symbol levels in the reference waveform, specified as a vector. If you do not provide ReferenceThresholds, the function calculates it from the histogram of yr.

Data Types: double

Sample time for uniformly sampled jittery and reference waveforms, specified as a scalar.

When you provide the time vectors of jittery and reference signals, the function ignores SampleInterval and uses time vectors instead.

Data Types: double

Symbol time for uniformly sampled jittery and reference waveforms, specified as a scalar. For clock waveforms, SymbolTime is half the of the period.

Data Types: double

Options to compare the data edge to the clock edge, specified as one of these:

  • time — Compares the closest edge times.

  • order — Compares the first edge on each set.

The function uses this argument in two scenarios only:

  • Both the measured and reference waveforms are clocks.

  • The measured waveform is a data waveform and the reference waveform is a clock waveform.

When both waveforms are data waveforms with the same pattern, the function matches the edges is based on the pattern.

Option to display histograms of jitter metrics, specified as true (1) or false or (0). The histograms include total jitter, random jitter, deterministic jitter, data-dependent jitter, sinusoidal jitter, inter-symbol interference, and duty cycle distortion.

Data Types: logical

Positive feedback gain for hysteresis, specified as a real scalar in the range [0, 1]. The function uses DebounceGain to calculate the modified thresholds by using the equation:

thresholdnew(i)=thresholdold(i)+DebounceGain·EyeAmplitude(i)2

Data Types: double

Fraction of a unit interval to hold the hysteresis threshold level before returning to the nominal threshold, specified as a nonnegative scalar in the range [0, 1].

Data Types: double

Custom channel delay, specified as a real scalar.

If your data has aggressive decision feedback equalization, you can manually override the channel delay compensation calculated by the jitter function and specify the delay of the measured waveform (x,y) with respect to the reference waveform (xr,yr). A positive Delaytime indicates that a reference edge matches to an edge later in time in the measured signal. A negative Delaytime indicates that a measured edge matches to an edge later in time in the reference signal.

Data Types: double

Metric Specific

collapse all

Maximum number of sinusoidal jitter frequencies to measure, specified as a scalar.

Data Types: double

Number of symbols prior to a given edge to correlate the jitter with, specified as a scalar.

Data Types: double

Number of symbols after a given edge to correlate the jitter with, specified as a scalar. If the signal uses PAM2 modulation, the default value for FutureSymbols is 0. For a modulation scheme of PAM3 or higher, the default value is 1.

Data Types: double

Reference for correlating duty cycle distortion, specified as oddeven or risefall.

Data Types: char

Bin edges for PDFs during correlation, specified as a vector.

By default, the function distributes BinEdges evenly with twice the resolution of Scott's rule.

Note

For best results, specify a bin centered at 0.

Data Types: double

Premeasured Jitter

collapse all

Data-dependent jitter value for each edge, specified as a vector.

If you specify DDJ, the function ignores the specified DCD and ISI values while estimating deterministic jitter and random jitter.

Data Types: double

Timing error values due to inter-symbol interference (ISI), specified as a vector or a structure.

The structure contains the correlation information and is the output of the jitterIntersymbol function. The structure must contain these fields.

FieldDescription
Mean

[N×M] matrix, where N is the number of modulation levels and M is the sum of future symbols and past symbols.

Mean denotes the ISI values for each symbol level at each delay.

SymbolIndex

M long vector, where M is the sum of future symbols and past symbols. The vector cannot contain 0.

SymbolIndex specifies the delay each column of Mean corresponds to.

Delay is relative to the symbol edge at which the function applies the ISI. A delay of 1 corresponds to the symbol after the edge, and a delay of -1 corresponds to the symbol prior to the edge.

The elements of the vector denote the ISI values for each edge.

Timing error values due to duty cycle distortion (DCD), specified as a vector or a structure.

The elements of the vector denote the DCD values for each edge.

The structure contains the correlation information and is the output of the jitterDutyCycle function. The structure must contain the Mean field, which is a 2-by-1 matrix. The first element is the odd or rising DCD value and the second is the even or falling DCD value.

Data Types: double

Sinusoidal jitter, specified as an N-by-3 matrix. N is the number of sinusoidal jitter (SJ) peaks or frequencies.

Each row of SJ contains the amplitude, frequency, and phase values. Amplitude must be in the same unit as SampleInterval and SymbolTime. Frequency is in the inverse of the unit of amplitude. Phase is in radians.

Data Types: double

Output Arguments

collapse all

Jitter metrics, returned as a structure.

Version History

Introduced in R2024b