Boost Power Train Operating Point Analysis
This example shows how to analyze the operating point of a power train for a boost switched-mode power supply (SMPS) using a Linear Circuit Wizard block from the Mixed-Signal Blockset™.
One of the first steps in the design of an SMPS is to determine the control duty cycle needed to obtain a desired steady state output under a fixed set of supply and load conditions, referred to as an operating point. This analysis must also create the power train small signal control model needed to design the power supply control loop.
Even before the control loop is designed, some form of operating point analysis is needed to choose the power train circuit topology and the circuit elements to be used in the power train. There are typically many options available, and each combination of options that can produce the required output must be analyzed for efficiency, output ripple, input ripple and cost in order to settle on a power train circuit design.
You can use the Linear Circuit Wizard to perform a complete operating point analysis, leading to a detailed power train circuit design and the models needed to design the power supply control loop. The design of the power supply control loop is demonstrated in a separate example, Feedback Amplifier Design for Voltage-Mode Boost Converter.
Power Train Circuit
The power train circuit design used in this example was adapted from a widely used tutorial on feedback loop analysis. Operating point analysis must be capable of providing comprehensive information on very detailed circuit designs, and so the circuit design used in this example includes detailed models of commercially available parts for the switching device, diode and inductor (except that the inductance is the 75uH of the original example instead of the 104uH for the commercial part). A load current source is included to model the powering of semiconductor devices, and the switching cycle control signal (Vcntl) is included as well.
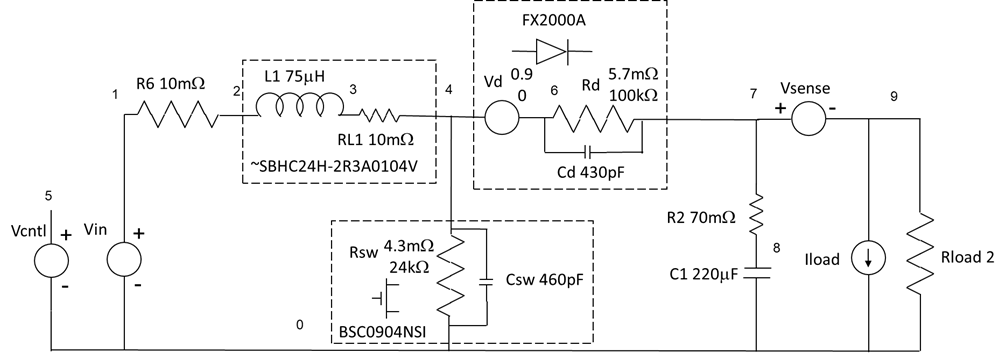
Two resistance values are shown for the switching device and the diode - an "on" resistance and an "off" resistance.
The circuit is described by the SPICE netlist TIBoostPowerTrain.sp, written in the Linear Circuit Wizard dialect and included with this example.
Analysis of a Single Design Point
The analysis process begins by configuring the analysis of a single set of circuit element values and operating conditions, referred to in this example as a "design point".
Once the analysis has been configured, you can run the analysis using the Analyze operating point button on the Operating Point Analysis tab of the user interface. This creates a plot of the selected output as a function of control input, along with a base workspace struct containing a table of DC results, a set of detailed waveforms, and the control system matrices needed to construct a small signal model of the power train for use in designing the power supply control loop. The name of the base workspace struct is the string 'Out' appended to the name of the configuration.
The steps to configure the analysis for a boost power train are described in the next subsection, followed by subsections on each of the outputs.
Configuration
The most convenient approach is to load one of the example configuration files and then modify the contents of the Linear Circuit Wizard block mask to meet your requirements.
The Operating Point Wizard block in the OperatingPointWizard model has been pre-loaded with the analysis configuration TIBoostCfg1.
modelName = 'OperatingPointWizard';
load_system(modelName);
lcwBlock = [modelName,'/Operating Point Wizard'];
open_system(lcwBlock);
ConfigurationName = 'TIBoostCfg1';
You can load a different configuration by setting the ConfigurationName parameter in the Operating Point Wizard mask to the name of the desired configuration file and either activating Load configuration in the block mask or using the loadConfiguration function included with this example.
You can also configure the analysis from empty mask using the following steps:
1. Load the circuit netlist.
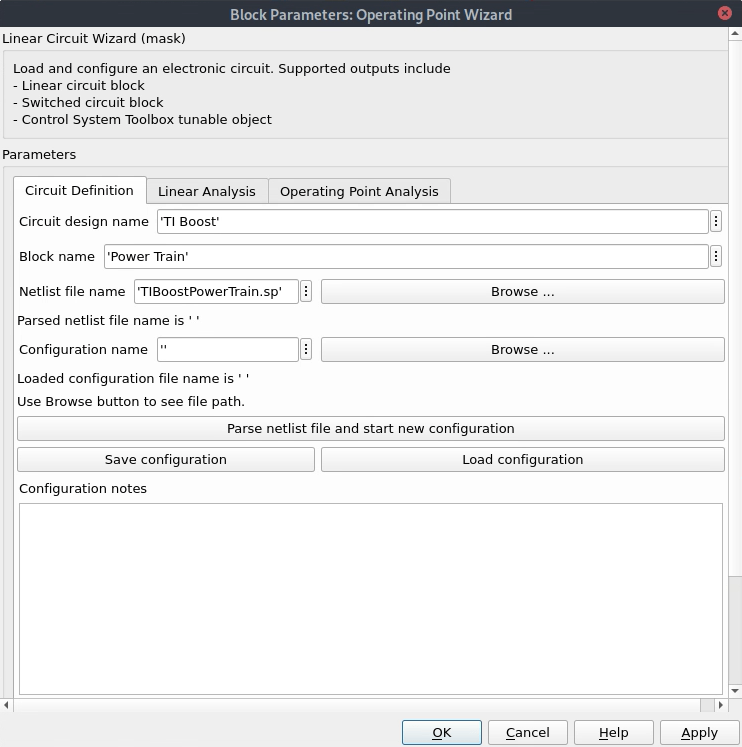
Use the netlist Browse button to select a netlist and then use the Parse netlist file and start new configuration button to parse the netlist and set up the remaining mask tabs.
2. Choose the input and output ports.
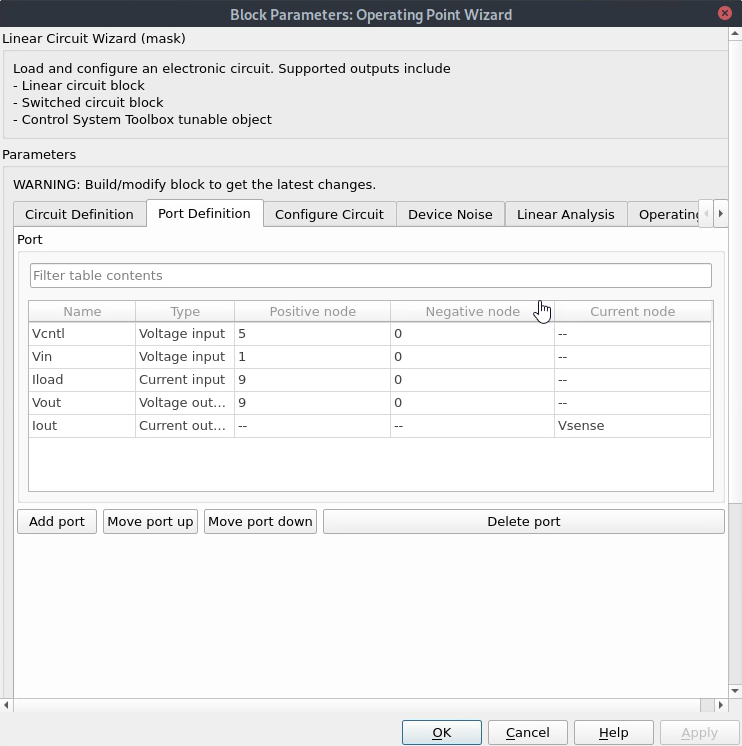
In this configuration all of the ports were set up by the circuit netlist. The Delete port button was then used to delete the Vd and Vsense ports that were not needed.
3. Set the number of switch states. and then define the role ("Type") each circuit element plays in the analysis.
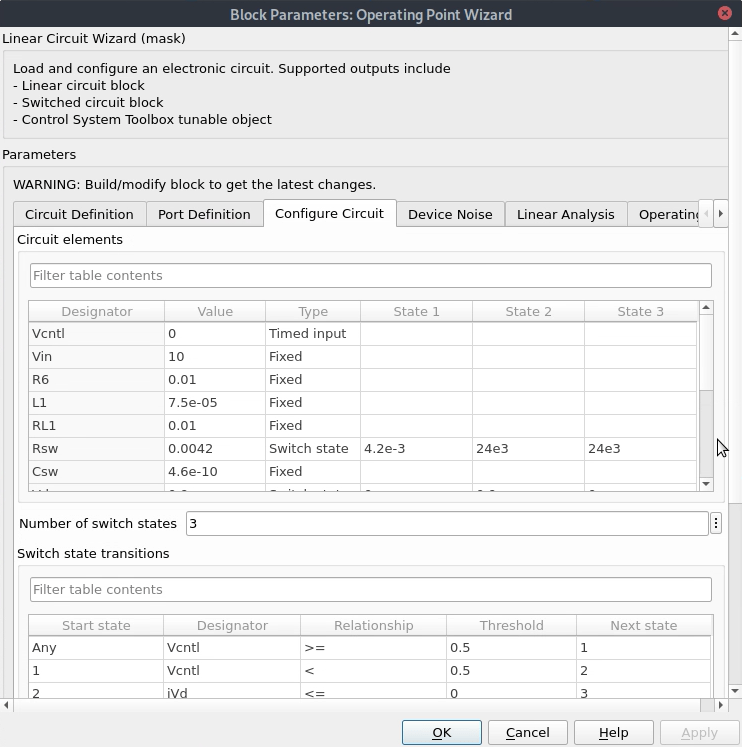
In this example the Vcntl Type was set to Timed input, indicating that this is the port where the precisely timed control waveform must be applied. Also, the values for the circuit elements Rsw, Vd, and Rd are a function of the switch state, and these values must be entered for each switch state.
5. Define the switch state transition rules.
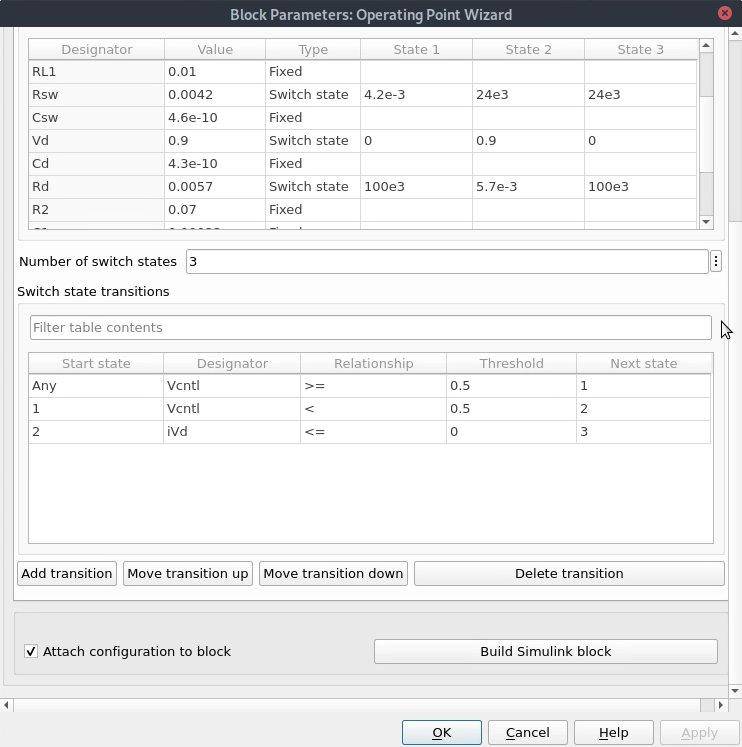
In this example there are three transition states. The circuit enters state 1 when the control input goes high and state 2 when the control input goes low. However when the diode current goes negative (iVd <= 0) the circuit enters discontinuous conduction mode, which is state 3.
6. Define the desired operating point(s) and control signal configuration.
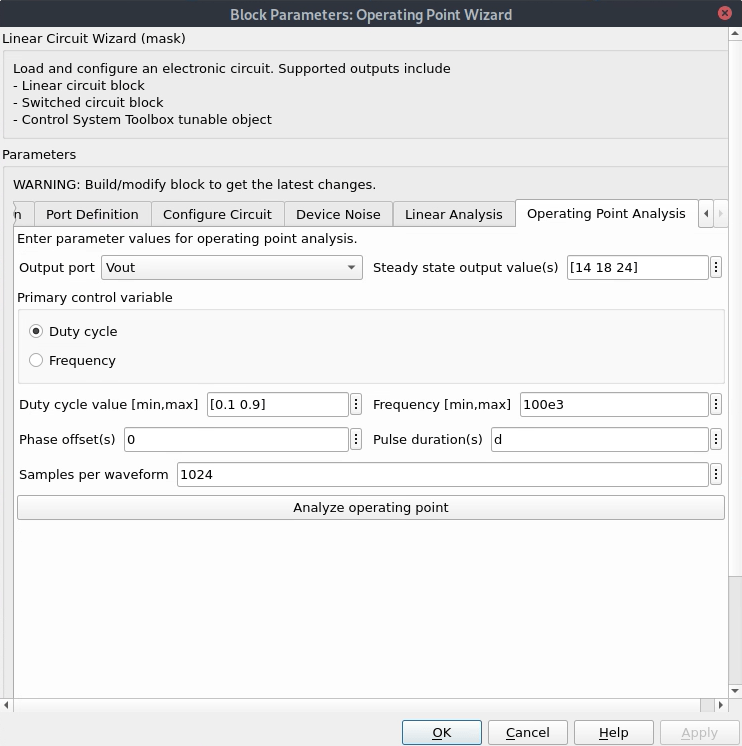
The desired output(s) and the timing of the control signal are defined on the Operating point analysis tab. Choose the output port that you want to have controlled and then enter one or more desired output values. In this example voltages of 14, 18 or 24 volts at output port Vout are specified.
7. Save the analysis configuration.
Once you've finished configuring the analysis you should go back to the Circuit definition tab to give the configuration a name, add some notes to remind you what the goal of the configuration was, and then use the Save configuration button to save a configuration file for later use.
8. Launch the analysis.
Use the Analyze operating point button to launch the analysis or use the mask callbacks directly.
msblks.Circuit.manageCircuitElementList(lcwBlock);
msblks.Circuit.packageCircuitAnalysis(lcwBlock,'Operating point analysis');
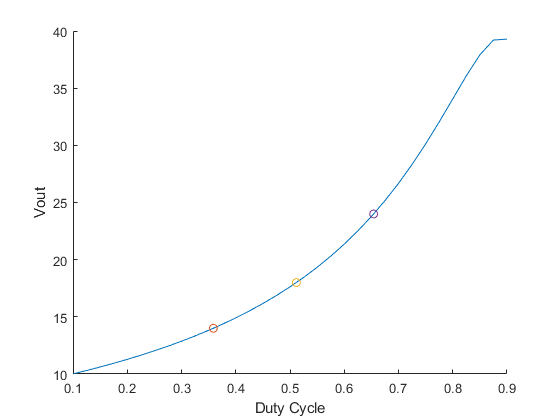
Results Table
TIBoostCfg1Out.DcResults
ans =

  3×6 table

    Duty Cycle    Frequency    Vin    Iload    Vout    Iout
    __________    _________    ___    _____    ____    ____

     0.35872        1e+05      10       0       14       7
     0.51172        1e+05      10       0       18       9
     0.65419        1e+05      10       0       24      12
Waveforms
TIBoostCfg1Out.Waves{2}(1:10,:)
ans =

  10×18 table

       Time        Vout      Iout     State    V5    V1      V2        V3          V4          V6         V7        V8        V9       iL1      iVcntl     iVin          iVd        iVsense
    __________    ______    ______    _____    __    __    ______    _______    ________    ________    ______    ______    ______    ______    ______    _______    ___________    _______

             0    17.488     8.744      1      1     10    9.8189    0.25718    0.076067    0.076067    17.488      18.1    17.488    18.111      0       -18.111    -0.00015738     8.744
    9.7656e-09    17.488    8.7439      1      1     10    9.8189     0.2572    0.076073    0.076073    17.488      18.1    17.488    18.112      0       -18.112    -0.00015737    8.7439
    1.9531e-08    17.487    8.7437      1      1     10    9.8189    0.25721    0.076078    0.076078    17.487    18.099    17.487    18.114      0       -18.114    -0.00015737    8.7437
    2.9297e-08    17.487    8.7435      1      1     10    9.8189    0.25723    0.076083    0.076083    17.487    18.099    17.487    18.115      0       -18.115    -0.00015737    8.7435
    3.9063e-08    17.487    8.7433      1      1     10    9.8188    0.25725    0.076088    0.076088    17.487    18.099    17.487    18.116      0       -18.116    -0.00015736    8.7433
    4.8828e-08    17.486    8.7431      1      1     10    9.8188    0.25727    0.076093    0.076093    17.486    18.098    17.486    18.117      0       -18.117    -0.00015736    8.7431
    5.8594e-08    17.486    8.7429      1      1     10    9.8188    0.25728    0.076099    0.076099    17.486    18.098    17.486    18.119      0       -18.119    -0.00015736    8.7429
    6.8359e-08    17.485    8.7427      1      1     10    9.8188     0.2573    0.076104    0.076104    17.485    18.097    17.485     18.12      0        -18.12    -0.00015735    8.7427
    7.8125e-08    17.485    8.7425      1      1     10    9.8188    0.25732    0.076109    0.076109    17.485    18.097    17.485    18.121      0       -18.121    -0.00015735    8.7425
    8.7891e-08    17.485    8.7424      1      1     10    9.8188    0.25734    0.076114    0.076114    17.485    18.097    17.485    18.122      0       -18.122    -0.00015735    8.7424
The waves continue for 1024 samples. Also note that the state and all of the node values are included in the table.
Small Signal Model
TIBoostCfg1Out.SSModels(2)
ans =

  struct with fields:

              A: [4×4 double]
              B: [4×3 double]
              C: [2×4 double]
              D: [2×3 double]
            tau: 1.0000e-05
     InputPorts: {'Vin'  'Iload'  'Duty cycle'}
    OutputPorts: {'Vout'  'Iout'}
Adding Metrics to the Analysis
Given the waveforms in the output struct you can implement your own metrics. The script getPowerTrainMetrics included with this example demonstrates the type of analyses that are possible. This script appends results to the DcResults table show above. It uses the function getCircuitElementPower to perform much of the detailed data access.
Run the getPowerTrainMetrics script, display the power analysis table, the efficiency metrics derived from the power analysis table, and the ripple metrics derived from the waveforms.
getPowerTrainMetrics;
Power Analysis Table
TIBoostCfg1Out.DcResults(:,7:18)
ans =

  3×12 table

    P_Vcntl     P_Vin      P_R6     P_RL1      P_Rsw      P_Vd      P_Rd       P_R2      P_Vsense     P_Rload    P_Iload     P_total
    _______    _______    ______    ______    _______    ______    _______    ______    __________    _______    _______    _________

       0       -109.19    1.1925    1.1925    0.18606     6.298    0.43624    1.7937    3.3149e-15    98.057        0        -0.03801
       0       -184.37    3.3997    3.3997    0.73998    8.0853     0.9457    5.5502    2.7313e-15    162.17        0       -0.084399
       0        -347.1    12.048    12.048     3.3226     10.79     2.3754      17.8    3.0725e-14     288.6        0        -0.11501
Efficiency and Ripple Metrics
TIBoostCfg1Out.DcResults(:,19:end)
ans =

  3×5 table

    Efficiency    Vin_ripple    Iin_ripple    Vout_ripple    Iout_ripple
    __________    __________    __________    ___________    ___________

     0.90792      0.0046524      0.46524        0.82912        0.41456
     0.89609      0.0065185      0.65185         1.4201        0.71003
     0.86136      0.0079875      0.79875         2.6524         1.3262