Using the Polyspace as You Code Perspective in Eclipse
The Polyspace® as You Code™ plugin has a dedicated perspective in the Eclipse™ IDE that groups all the relevant Polyspace views.
To open the Polyspace
as You Code perspective, click ![]() on the far right of the toolbar. If the perspective
is already open but a different perspective is active, click
on the far right of the toolbar. If the perspective
is already open but a different perspective is active, click ![]() to return to the Polyspace perspective.
to return to the Polyspace perspective.
The different views in the Polyspace
as You Code perspective show information about the state of your configuration and
about the files that you select for analysis. For more information, click ![]() in each view (when available) to open the
documentation.
in each view (when available) to open the
documentation.
Quality Monitoring View
The Quality Monitoring view shows all the files that you have selected for analysis, along with the status of the analysis and the number of results for each file.
To analyze a file, select that file and click ![]() . You can also start a sequential file-by-file
analysis by clicking
. You can also start a sequential file-by-file
analysis by clicking ![]() .
.
Open the settings on the Analysis node by clicking ![]() to configure adding files to this view on save.
See Eclipse: Configure Polyspace as You Code Plugin. To add a file
manually, right-click the file in the editor or in the Project
Explorer.
to configure adding files to this view on save.
See Eclipse: Configure Polyspace as You Code Plugin. To add a file
manually, right-click the file in the editor or in the Project
Explorer.
If you remove a file from the Quality Monitoring view after you have run an analysis on that file, Polyspace removes the results associated with that file as well as all the included files. If you add the removed file back to the Quality Monitoring view, no results are associated with the file until you run a new analysis.
If you remove a file from the Quality Monitoring view after you have run an analysis on that file, Polyspace removes the results associated with that file as well as all the included files. If you add the removed file back to the Quality Monitoring view, no results are associated with the file until you run a new analysis.
Headers View
When you analyze a file, Polyspace also analyzes the header files that are included by and that are in the same folder as the analyzed file. If Polyspace reports results in a header file, you see an H next to the analyzed file in the Quality Monitoring view. Click the analyzed file in that view to list the headers file in the Headers view.
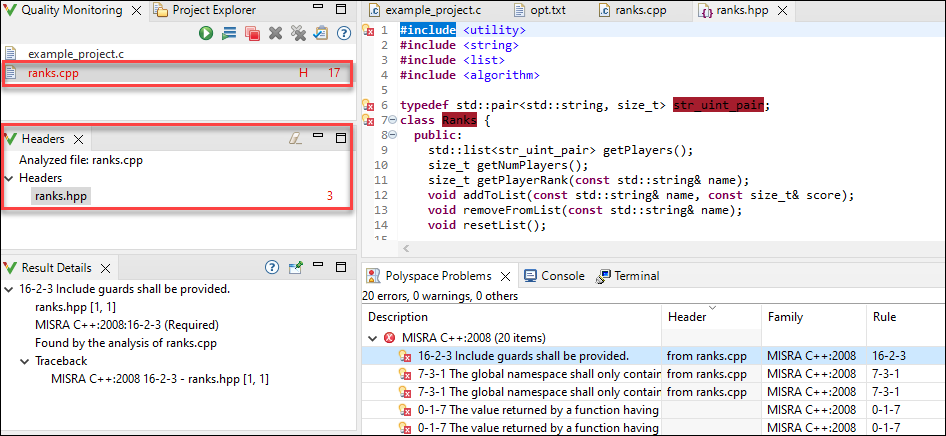
You see header files in the list only if they contain results. Click the file in the Headers view to open its results in the Polyspace Problems view.
Polyspace Problems View
The Polyspace Problems view shows the all the analysis results listed as one result per line. Each line shows additional information, such as:
The rule name, family, and description.
Name of the file containing the result. If this file is a header, the Header columns show the name of the source file containing this header file.
Review information
The results are grouped by results family. To change the grouping or view a flat list, click the three vertical dots and select Grouping options.
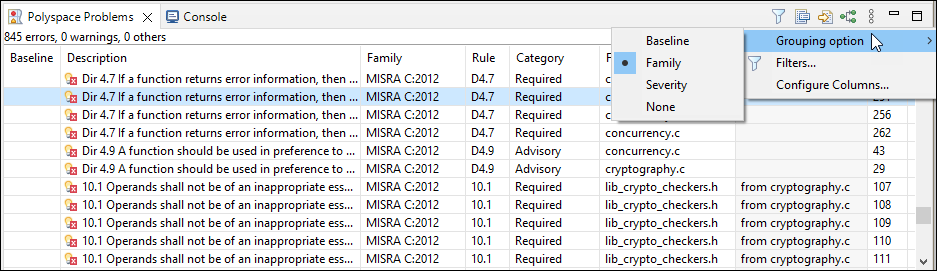
Click a column header to sort results by the content of that column. For instance, you can sort results by files.
The results that show in the Polyspace Problems view represent the results for the files that you select in the Quality Monitoring view. The number of results in the Polyspace Problems view can change and does not represent results for all analyzed files.
When you select a file in the Quality Monitoring view, in the Polyspace Problems view you see results from:
Each file listed in the Quality Monitoring view, including the selected file.
The header files of the file you select in the Quality Monitoring view.
If you select a different file in the Quality Monitoring view:
Polyspace removes the previously selected file's header file results from the Polyspace Problems view.
The newly selected file's header file results show in the Polyspace Problems view.
Result Details View
When you select a result in the Polyspace Problems view or in the editor, the Result Details view shows additional information about the result, including (when available) the traceback and the review information imported from the baseline.
If you select multiple lines of code, this view shows the result details for all
the results in the selection. Click ![]() to view contextual help about the selected
result.
to view contextual help about the selected
result.
To lock this view while you browse results in the source code or the
Polyspace Problems view, click ![]() . The view does not update when you select a
different result. Click the icon again to unlock the view.
. The view does not update when you select a
different result. Click the icon again to unlock the view.
Configuration View
The Configuration view shows the current analysis settings and the status of the generated build options, if applicable.
Click
 to generate a build options file.
This button is available only if you configure the plugin to extract
build options from your build command, from your Eclipse C/C++ project,
or from a JSON compilation database. See Eclipse: Generate Build Options for Polyspace as You Code.
to generate a build options file.
This button is available only if you configure the plugin to extract
build options from your build command, from your Eclipse C/C++ project,
or from a JSON compilation database. See Eclipse: Generate Build Options for Polyspace as You Code.Click
 to open the settings on the
Analysis node. See Configure Analysis Settings.
to open the settings on the
Analysis node. See Configure Analysis Settings.Click
 to open the Checkers
selection interface. See Eclipse: Configure Checkers and Coding Rules in Polyspace as You Code.
to open the Checkers
selection interface. See Eclipse: Configure Checkers and Coding Rules in Polyspace as You Code.
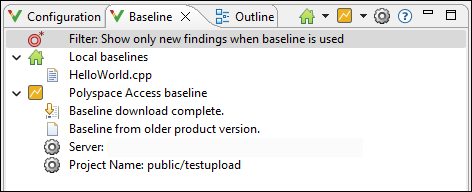
Baseline View
View current filter settings (show new results only or show all results), any available local baselines, and the status of the download for the Polyspace Access™ baseline. If you have configured the baseline settings, you see information about the Polyspace Access server and the project you use as a baseline. See Eclipse: Configure Baseline Results in Polyspace as You Code.
In this view, you can:
Click the filter button to enable or disable filtering for only results that are new compared to a baseline.
Click the arrow next to
 and select Create a local
baseline for all files in the Quality Monitoring list or
Update all local baselines.
and select Create a local
baseline for all files in the Quality Monitoring list or
Update all local baselines.Click
 to download a Polyspace
Access baseline.
to download a Polyspace
Access baseline.Click the arrow next to
and select Open project in
Access Web to open the baseline in the Polyspace
Access interface.Click
 to open the baseline settings.
Click
 to download or update a
baseline.
to download or update a
baseline.
To remove a baseline, right-click the baseline and select next to the name of the baseline.
If the results from the baseline run are generated with a Polyspace product version that is older than your Polyspace as You Code version, the view shows a warning.