Simulate and Visualize Range and Doppler Intensity Data in an End-to-End Radar System
Introduction
This example demonstrates how to model an end-to-end radar system and use the scopes to visualize range-intensity and Doppler-intensity data over time in Simulink®. The range-time intensity and Doppler-time intensity scope help to acquire the target in the environment, by showing how the target's range and Doppler change over time.
Exploring the Example
The following example shows an end-to-end simulation of a monostatic radar system. The system is divided into following sections: the transmitter, the platform subsystem, the propagation channel, the targets, the receiver subsystem and the visualization. The flow of signal is as shown starting from the transmitter, through the channel and target and reflected to receiver. The received data is then processed in range and Doppler domain independently to obtain the range-intensity and Doppler-intensity data for visualization.

Transmitter
Rectangular - Creates rectangular pulse as the transmitter waveform of 3 MHz bandwidth, corresponding to a 50-meter range resolution.
Radar Transmitter - Amplifies the pulse. The operating frequency of the transmitter is 1 GHz.
Narrowband Tx Array - Simulates the signals radiated from the antenna. The first input (X) to this block is a column vector which contains the transmitted pulses. The pulses are assumed to be narrowband with a carrier frequency equal to the operating frequency specified in the block's dialog box. The second input (Ang) specifies the radiating direction of the pulses. The antenna is configured in Sensor Array tab of the block's dialog box.
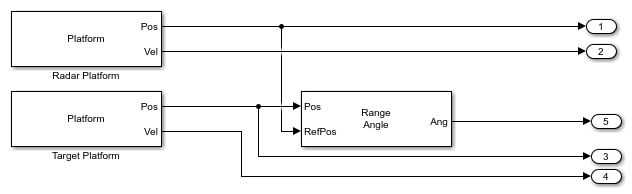
Platform
The platform subsystem models the motion of radar as well as the target. The positions and velocities of the radar and targets are used by the Channel block to model propagation and by the Range Angle block to compute the signal's incident angles at the target location.
Radar Platform - Used to model the radar's motion. The radar is mounted on a stationary platform located at the origin.
Target Platform - Used to model the target's motion. In this example, there are three targets. The first one positioned at approximately 2000 meters from the radar and is moving away from the radar at 1500 m/s, second target positioned at 3845 meters from the radar and is moving towards the radar at 1500 m/s and third one is a stationary target at 3532 meters from the radar.
Range Angle - Computes the propagated signal's incident angles in azimuth and elevation at the target's location.
Channel and Targets
Channel - This block performs two-way propagation, propagating signal from transmitter to target and propagating the reflected signal from target to receiver. The signal output has three columns one for two-way propagation path of each target.
Targets - Reflects the signal according to the radar cross section (RCS) specified in the mean radar cross section parameter of the Target block.
Receiver
Narrowband Rx Array - Simulates the signals received at the antenna. The first input to this block is a matrix which contains the received pulses from each of the target. The pulses are assumed to be narrowband with a carrier frequency equal to the operating frequency specified in the block's dialog box. The second input (Ang) specifies the incident direction of the pulses. The antenna is configured in Sensor Array tab of the block's dialog box.
Receiver Preamp - Receives the target echoes and adds noise.
Range Processing Subsystem - Performs matched filtering to improve SNR, followed by time-varying gain to compensate for range loss and finally integrates 10 pulses noncoherently.

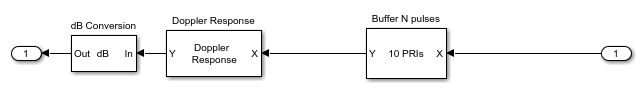
Doppler Processing Subsystem - The received signal is buffered for 10-pulse burst, followed by FFT along the Doppler dimension to estimate the Doppler information of the received pulse.
Visualization
Range-Time Intensity Scope - This scope is used to visualize the range-intensity data over time. The scope is configured prior to the simulation start to visualize the target's range variation over time. The range processed data is input to the block.
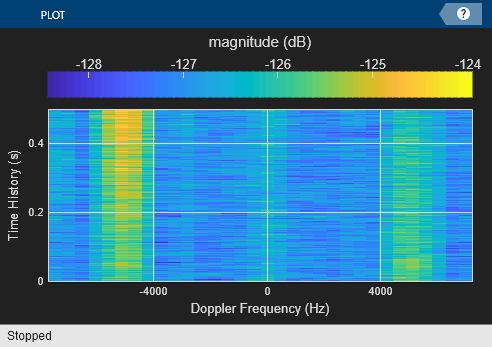
Doppler-Time Intensity Scope - This scope is used to visualize the Doppler-intensity data over time. The scope is configured prior to the simulation start to visualize the target's radial speed over time. The Doppler processed data is input to the block.
Exploring the Model
Several dialog parameters of the model are calculated by the helper function helperslexRadarSystemVisualParam. To open the function from the model, click on Modify Simulation Parameters block. This function is executed once when the model is loaded. It exports to the workspace a structure whose fields are referenced by the dialogs. To modify any parameters, either change the values in the structure at the command prompt or edit the helper function and rerun it to update the parameter structure.
Results and Displays
The range-time intensity scope and Doppler-time intensity scope shows range and Doppler detections of three targets over time. From the Range-Time Intensity scope and Doppler-Time Intensity scope it can be seen that there are three targets, out of which two are moving along the x-axis and one is stationary.

The Range-Time Intensity scope shows the variation in the range intensity data of each of the targets over time. Two targets are moving along the x-axis starting at 2000 km and 3500 km respectively and one target is stationary at 4000 km.
The Doppler-Time Intensity scope shows that there are 2 moving targets and one stationary target which agrees with the target velocity configuration.
Summary
This example demonstrates how an end-to-end radar system can be modeled within Simulink and how to visualize the range and Doppler intensity data over time using the Range-Time Intensity scope and Doppler-Time Intensity scope respectively.