Load and View Point Cloud Data
R2026bOpen Lidar Labeler App
To open the Lidar Labeler app, at the MATLAB® command prompt, enter this command.
lidarLabeler
Alternately, you can open the app from the Apps tab of the MATLAB toolstrip, under Image Processing and Computer Vision. The app opens to an empty session.
Import Point Cloud Data
You can load point clouds from multiple types of data sources into the Lidar Labeler app. On the app toolstrip, select Import > Add Point Cloud > From File to open the Select Point Cloud dialog box, when enables you to specify a file from which to load a point cloud.
Import Point Cloud Sequence
In the Select Point Cloud dialog box, the default value of Source Type parameter is Point Cloud Sequence.
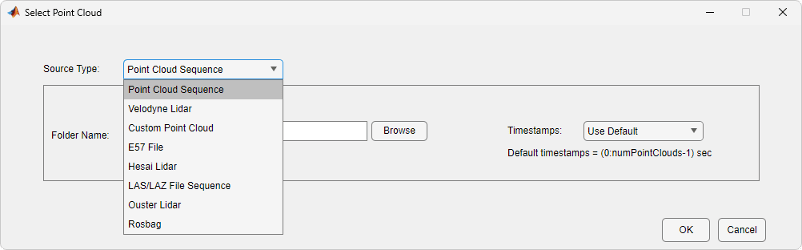
To specify Folder Name parameter, select Browse and navigate to the folder that contains the sequence of point cloud data (PCD) files you want to load and click Select Folder.
To specify timestamps using a MATLAB workspace variable, set the Timestamps parameter to
From
                                Workspace
and, in the Import From Workspace dialog box, select a variable with thedurationdata type and click OK. Otherwise, set Timestamps toUse Default.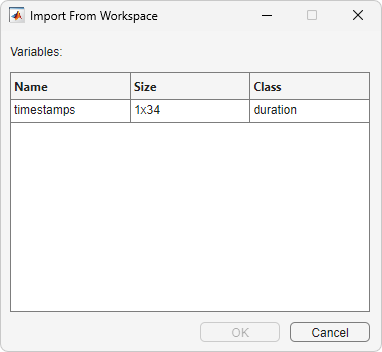
In the Select Point Cloud dialog box, select OK. The app loads the specified point cloud sequence.
Note
When Source Type is Point Cloud Sequence, the app reads point cloud frames lexicographically, where the arrangement of characters, words, or numbers is in alphabetical order.
Other Import Options
You can also import data from these sources into the app.
To load data from Velodyne Lidar sensors, you must additionally specify the calibration file and the device model for the sensor.

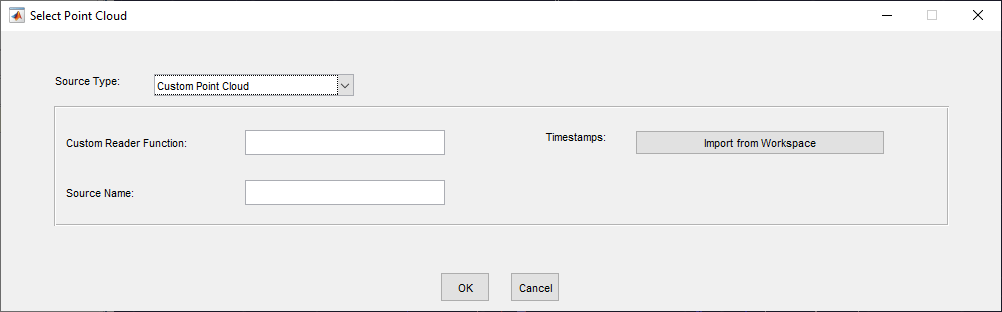
You can load data from a custom source by specifying a custom reader function. Specify Source Name as the path to the data folder.
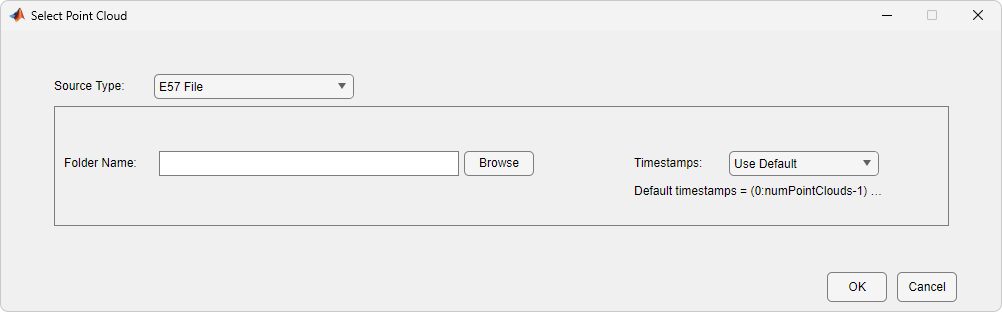
Specify the Folder Name, and Timestamps parameters.
Specify the File Name, Calibration File, Device Model, and Timestamps parameters.

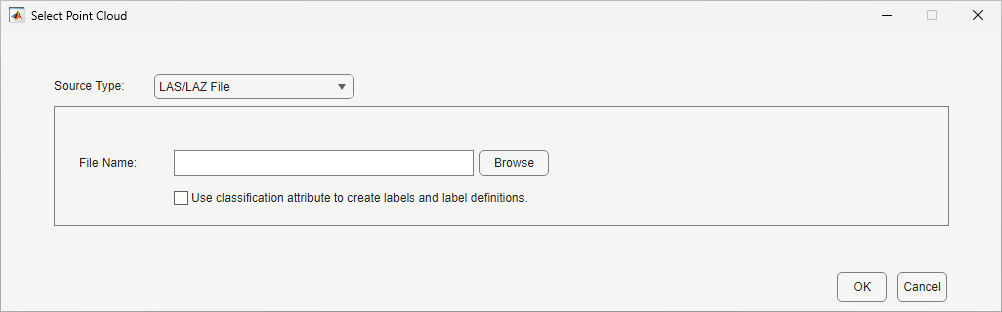
Specify File Name of a LAS or LAZ file. To import classification attributes stored in the LAS/LAZ file, select Use classification attribute to create labels and label definitions parameter. The app automatically creates voxel labels and label definitions. For more information on classification categories of a LAS/LAZ file, see Classification.
Specify the File Name, Calibration File, and Timestamps parameters.

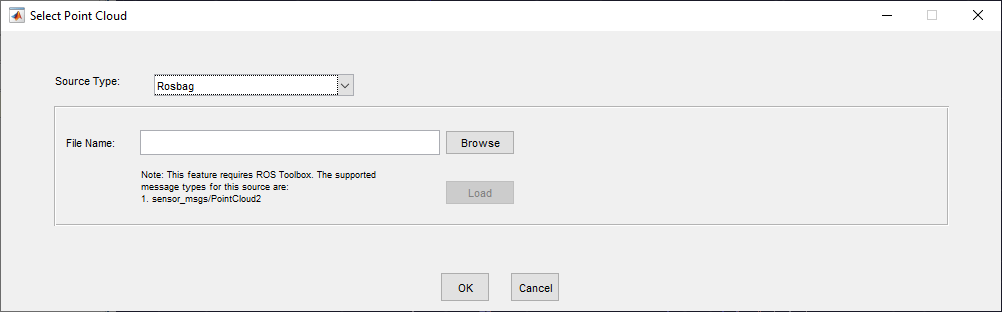
Specify Folder Name as the path to a folder containing rosbag file.
Alternately, select Import > Add Point Cloud > From Workspace to import data from the MATLAB workspace.
Visualize Point Cloud Data
Labeling 3-D point cloud data is a challenging task due to the sparse and unstructured nature of the data. The Lidar Labeler app provides a variety of visualization options on the LIDAR tab of the app toolstrip, enabling you to more easily label 3-D data points.
Color Controls
On the LIDAR tab of the app toolstrip, you can choose color options to control the display of the point cloud.

Choose the color profile for the point cloud data, from these options.
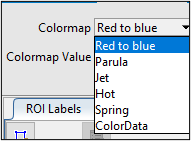
The app enables the ColorData option only when the input point cloud data has color information.
Choose how the color profile applies to the point cloud, from these options:
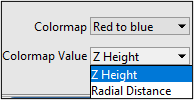
Z Height— The color changes as the distance between points increases.Radial Distance— The color changes as the distance between points and the ego vehicle increases.
ROI View Options
On the Lidar tab of the app toolstrip, you can choose options to select, reset, or save a region of interest (ROI) for the point cloud data.
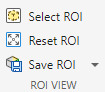
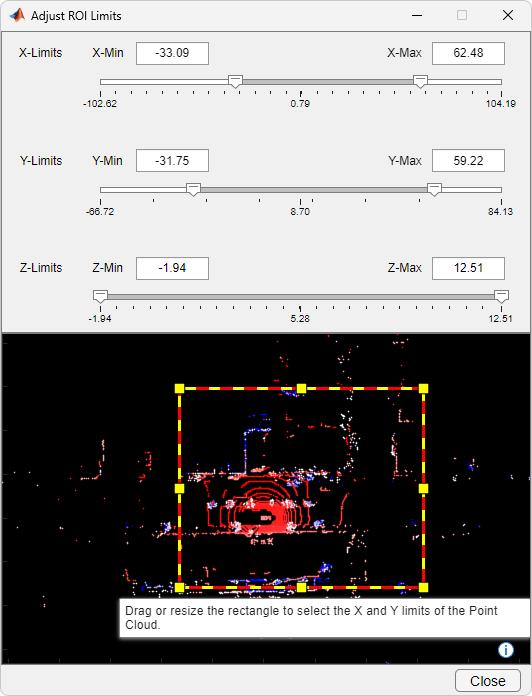
Click Select ROI to define and view a region of interest (ROI) in the point cloud. The app opens the Adjust ROI Limits dialog box, which contains the ROI parameters. Specify the x-, y-, and z-axes limits for the ROI. The dialog box also visualizes the rectangular ROI on the xy-axes of a point cloud. You can also adjust x- and y-limits for the ROI by dragging and resizing the rectangle on the xy-plane.
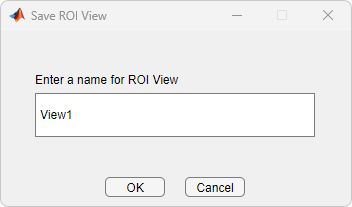
To save the selected ROI, click Save ROI. The app opens the Save ROI View dialog box. Enter a name for the ROI view and click OK.
To view a previously saved ROI, from the Save ROI list, select the desired view.

Camera View Options
Use these camera options to view, adjust, and compare your point cloud and label data.
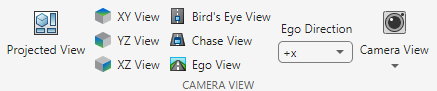
Use projected view to adjust the cuboid label in top-view, side-view and front-view simultaneously. For more information on how to create labels and label definitions, see Create and Export Labels and Label Definitions.
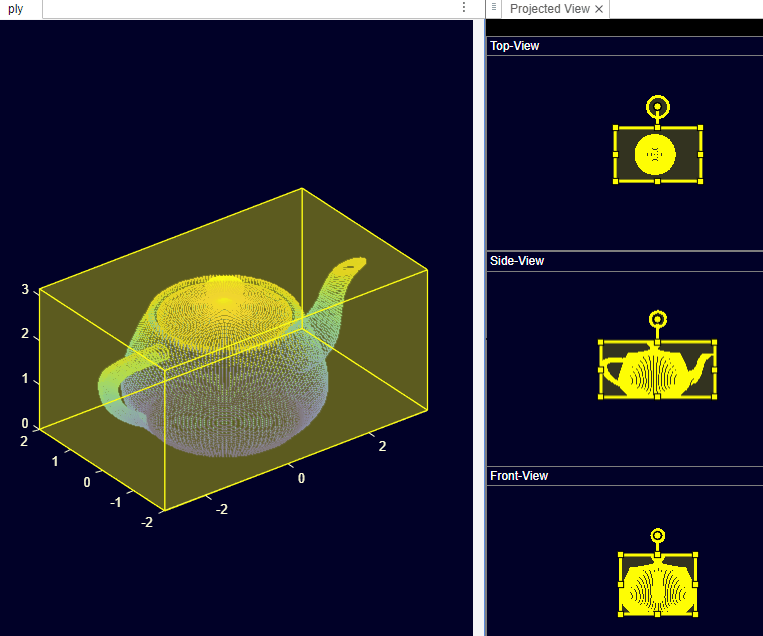
View the xy-axes of a point cloud. This is the top view of the scene, line of sight is along z axis.
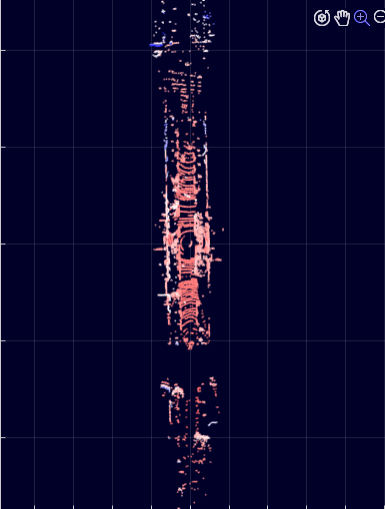
View the yz-axes of a point cloud. This is the front view of the scene, line of sight is along x axis.

View the xz-axes of a point cloud. This is the side view of the scene, line of sight is along y axis.

View from a high angle above a point cloud.
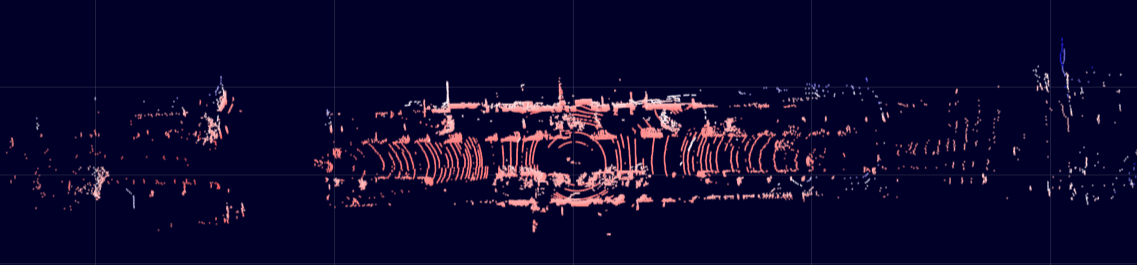
View the point cloud from a fixed distance behind the ego vehicle (actor).
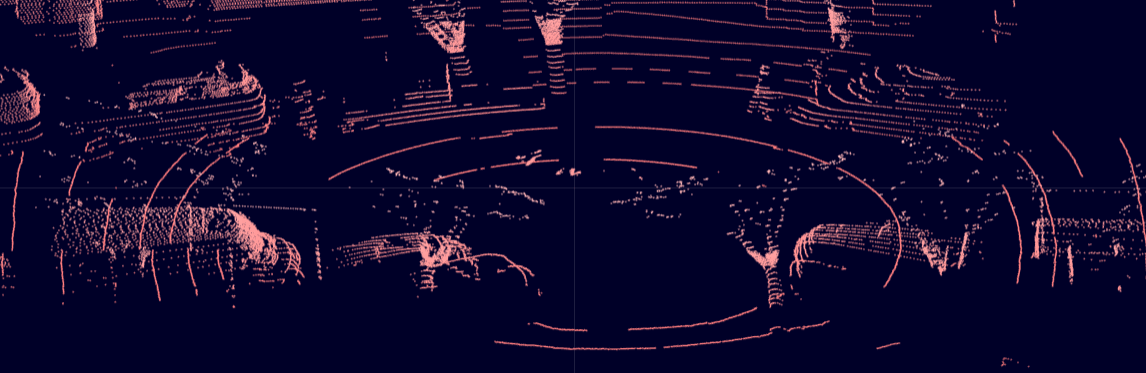
View a point cloud from the perspective of the ego vehicle.
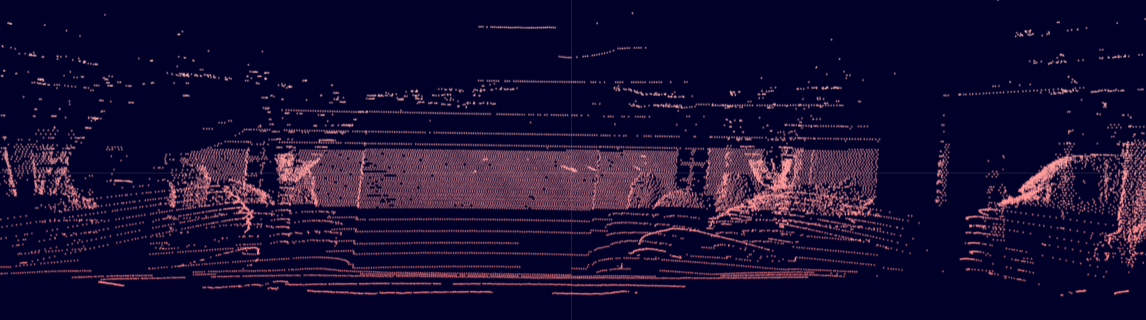

Select Camera View to save and reuse custom views of the point cloud data. You can interactively rotate, pan, and zoom the camera to create a view, then save the view by clicking Camera View and selecting Save Camera View. Specify a name for the view and select OK. You can return to the saved view at any time by clicking Camera View and selecting the saved view from the list. Select Organize Camera Views from the list to delete or rename the saved views.
To restore the point cloud display to the default view, click Camera View, and then click Restore Default Camera View. Note that the default camera view does not restore the default values of the axis limits. You must click Reset ROI to reset the axis limits.
Point Size Option
To adjust the displayed point size of the point cloud, specify the value of the Point Size parameter.

Ground View Options
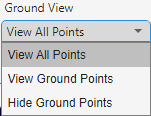
Set Ground View to specify whether the visualization displays all the points, only the ground points, or only the nonground points in the point cloud.
Select Ground Settings to change the ground segmentation algorithm and tune the corresponding parameters.
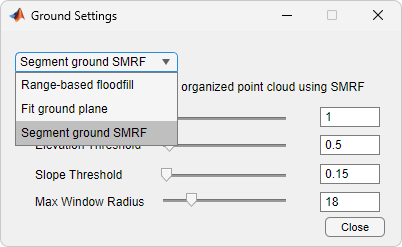
In the Hide Ground dialog box, select a segmentation algorithm from the list. The dialog box then displays the parameters for the selected algorithm, along with their values, and a slider for each with which to adjust that parameter value, to fine-tune your ground segmentation results. The app supports these algorithms:
Segment ground SMRF(default) — Segment the ground plane in either organized or unorganized point cloud data using thesegmentGroundSMRFfunction. Use this algorithm for non-uniform ground planes and aerial lidar data. The default parameters have been tuned for aerial data. For ground lidar data, decrease the Max Window Radius parameter to5and the Elevation Threshold parameter to a value in the range [0.2,0.3].Range-based floodfill— Segment the ground plane in organized point cloud data using thesegmentGroundFromLidarDatafunction.Fit ground plane— Segment the ground plane in organized point cloud data using thepcfitplanefunction.

