Source Code in Polyspace Access Web Interface
The Source Code pane shows the source code with the defects colored in red.
Tooltips
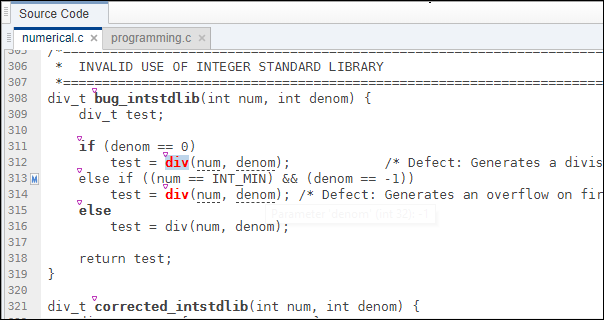
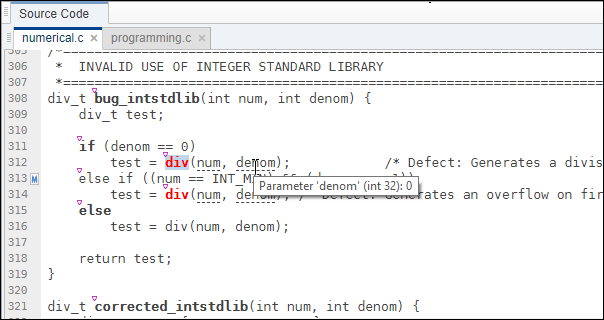
Placing your cursor over a result displays a tooltip that provides range information for variables, operands, function parameters, and return values.
Examine Source Code
On the Source Code pane, if you right-click a text string, the context menu provides options to examine your code:
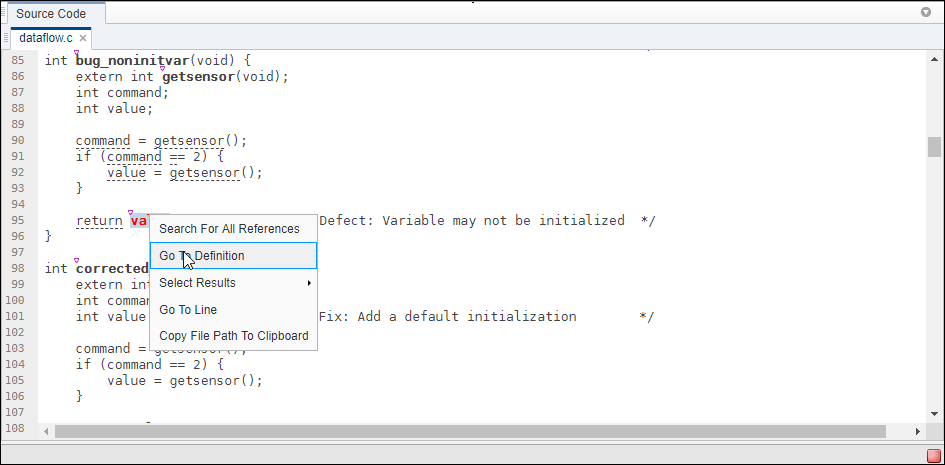
For example, if you right-click the variable, you can use the following options to examine and navigate through your code:
Search For All References — List all references in the Code Search pane. The software supports this feature for global and local variables, functions, types, and classes.
Go To Definition — Go to the line of code that contains the definition of
i. The software supports this feature for global and local variables, functions, types, and classes. If a definition is not available to Polyspace®, selecting the option takes you to the declaration.Select Results –– Show more information about the selected result in the Results Details pane and pin the result in the Source Code pane.
After you navigate away from the current result, use the
 icon on the Result
Details pane to come back.
icon on the Result
Details pane to come back.Go To Line — Open the Go to line dialog box. If you specify a line number and click Enter, the software displays the specified line of code.
To search for instances of your selection in the Current Source File or in All Source Files, double-click your selection before you right-click.
Expand Macros
You can view the contents of source code macros in the source code view. A code
information bar displays ![]() icons that identify source code lines with
macros.
icons that identify source code lines with
macros.
When you click this icon, the software displays the contents of macros on the next line.
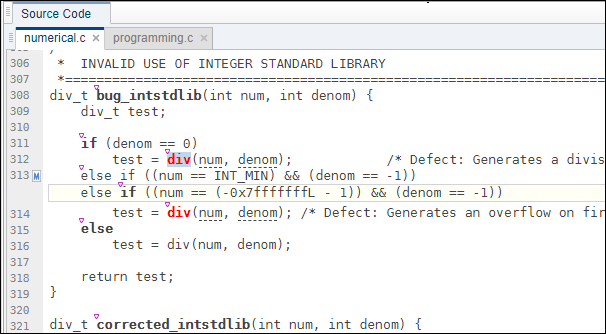
To display the normal source code again, click the icon again.
Note
The Result Details pane also allows you to view the contents of a macro if the check you select lies within a macro.
You cannot expand OSEK API macros in the Source Code pane.
View Code Block
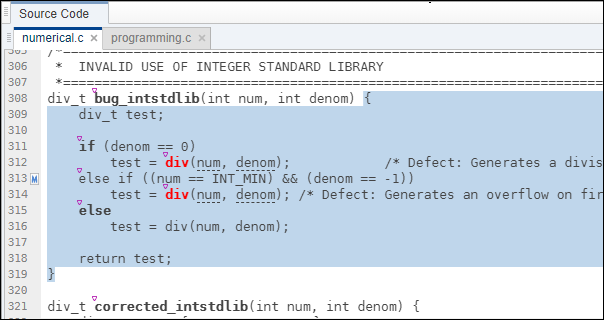
On the Source Code pane, to highlight a block of code, click either its opening or closing brace. If the brace itself is highlighted, click the brace twice.
Navigate from Code to Model
If you run Polyspace on generated code in Simulink® and upload the results to Polyspace Access, you can navigate from the source code in Polyspace Access to blocks in the model.
On the Source Code pane in the Polyspace Access web interface, links in code comments show blocks that generate the subsequent lines of code. To see the block in the model:
Right-click a link and select Copy MATLAB Command to Highlight Block.
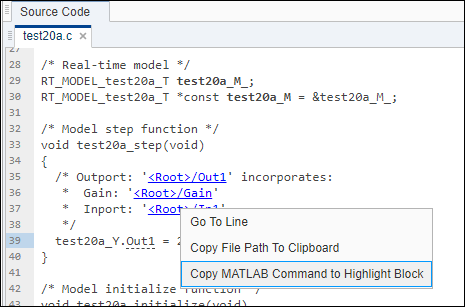
This action copies the MATLAB® command required to highlight the block. The command uses the
Simulink.ID.hilite(Simulink) function.In MATLAB editor, paste and run the copied command with the model open.