Calculate Code Profile by Using Makefile
Using Polyspace® Test™, you can calculate C/C++ code profiling metrics, such as code coverage, execution time, and memory use:
The metric
Code Coveragemeasures how much of your code is covered by the existing test cases. Measure the value of different code coverage metrics by using Polyspace Test and add appropriate test cases to achieve your desired level of coverage. Polyspace Test calculates code coverage for standard metrics. See Review Code Profiling Results.The metric
Execution Timecomputes the time required to execute the different callable entities of your code. SeeExecution Time.The metric
Memory Usemeasures how the callable entities use the available stack memory. SeeMemory Use.
If you use a Makefile to build your source code, you can leverage the Makefile to calculate these metrics. You can follow one of these workflows:
Using a Polyspace Platform project — Create a new Polyspace Platform project from your Makefile. Add test cases to the project and calculate code coverage or execution profile in the Polyspace Platform user interface or automate the calculating by using the Polyspace Test command line interface. For details about this workflow, see Create Project and Add Source Files in Polyspace Platform User Interface.
Without using a Polyspace Platform project — Write C/C++ tests using the Polyspace Test xUnit API. Modify your Makefile to build the tests along with your sources and run the
makecommand on this modified Makefile.
This example shows how to modify your Makefile to instrument source files for code profile calculation, build these instrumented sources along with tests, and product results showing the code profile.
Prerequisites
To follow this example:
Check if the
makecommand is available. In Linux® systems, check the availability ofmakeby entering this code at the command line:make -version
If the command is not available, install the
makeutility. In Windows®, if you use Microsoft® Visual Studio®, you can use thenmakecommand instead of themakecommand.This example assumes a 64-bit Linux system. If you use an environment other than 64-bit Linux or 64-bit Windows, recompile the Polyspace Test runtime static library for your environment. See Create Library for Code Profiling Using Self-Managed Builds.
Copy the content of the folder
polyspaceroot\polyspace\examples\doc_pstest\coverage_data_collectionpolyspacerootC:\Program Files\Polyspace Test\R2026a.Before using the makefiles, specify the variable
POLYSPACEROOTas your Polyspace Test installation folder.
Modify Makefile for Code Profiling
The folder coverage_data_collection contains source files and associated tests. These tests are written using the xUnit API for Polyspace Test. The Makefile in the folder coverage_data_collection generates an executable by compiling the source and test files.
Verify that the Makefile executes successfully. At the command line, enter:
make
testrunner. Executing testrunner runs tests on the source code. Verify that all five tests pass.Modify the Makefile to perform these steps:
Instrument the source code with code profile macros.
Generate a test executable by compiling the instrumented source code.
Collect data by running the instrumented test executable.
Create a human readable report from the collected data.
For details about this workflow, see Calculate C/C++ Code Coverage Using Self-Managed Builds.
In the
Makefile, define these new environment variables:The variable# Path to the polyspace-code-profiler executable. PSPROF = $(POLYSPACEROOT)/polyspace/bin/polyspace-code-profiler # Path to the source files. CodeToInstrum = src/ # Folder where polyspace-code-profiler outputs the instrumented source files. instrumFolder = instrumFolder/ runFolder = runFolder/ reportFolder = reportFolder/ # Path to the runtime library PSLIB=$(POLYSPACEROOT)/polyspace/psprofile/lib/glnxa64/static/libmwpsprofile_cli_runtime.a$(PSLIB)points to the Polyspace Test runtime static library. If you recompiled the library for your environment, point$(PSLIB)to the recompiled static library.To instrument your source code for code profiling, declare a new variable
CC_COV. You can calculate one of the code coverage, execution time, or memory use metrics at a time. Depending on which metric you want to calculate, defineCC_COVdifferently:Code coverage:
here, the optionCC_COV = $(PSPROF) -instrument -limit-instrumentation-to $(CodeToInstrum)\ -instrum-dir $(instrumFolder) -cov-metric-level mcdc\ -- $(CC)-cov-metric-level mcdcspecifies that Polyspace instruments the source code to calculate all the available code coverage metrics includingmcdc.Execution time:
CC_COV =  $(PSPROF) -instrument -limit-instrumentation-to  $(CodeToInstrum)\
  -instrum-dir  $(instrumFolder) -exec-metric-level detailed\
  -prof-counter-size 64 -- $(CC)
Memory use:
CC_COV =  $(PSPROF) -instrument -limit-instrumentation-to  $(CodeToInstrum)\
  -instrum-dir  $(instrumFolder) -stack-metric-level detailed\
  -prof-counter-size 64 -- $(CC)
For more information on the
-instrumentcommand, seepolyspace-code-profiler.To instrument your code for code coverage calculation, in the target
objects, replace$(CC)with$(CC_COV).Append
$(PSLIB)to the target$(PRG).Create new targets to collect code profiling data and generate the report:
Here,#Run test executable and collect coverage data run: $(PRG) $(PSPROF) -run -instrum-dir $(instrumFolder) -results-dir $(runFolder) -- $(PRG) #Generate report report: run $(PSPROF) -report -html -report-dir $(reportFolder) $(runFolder)/output_run.psprof$(runFolder)is a new variable defining the folder containing the output data.$(reportFolder)is a new variable defining the folder containing the generated report.
At the command line, enter
make report. The folder defined by$(reportFolder)contains the HTML reports.Save the modified Makefile as
modified_makefile. The expander shows themodified_makefilefor code coverage calculation.After modifying the makefile, generate a code profile report by using a single make command:
make -f modified_makefile
After generating the report, review the results.
Review Code Profile Results
After generating the report, open the HTML file in $(reportFolder).
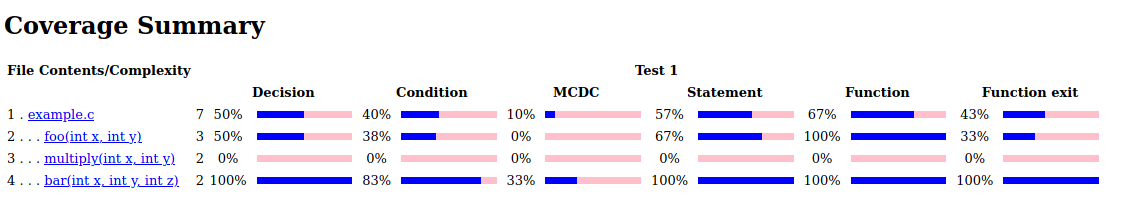
The results indicate that none of the functions have complete test coverage. To check which execution paths are not covered by tests, review the coverage metrics. For instance, there are no tests for the execution path where the decision (x < 0 && y>0) is true.
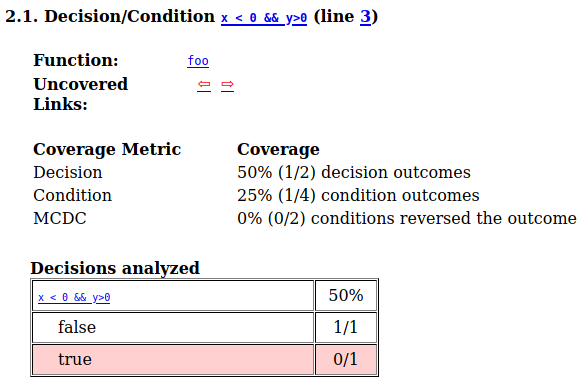
To increase the coverage, add new tests that cover the untested execution paths. See Improve or Justify Missing Code Coverage Results.
if you calculate other code profiling metrics, see:
Execution time: Review and Address Execution Time Results.
Memory Use: Review and Address Memory Use Results.
See Also
Topics
- Create Project and Add Source Files in Polyspace Platform User Interface
- Calculate C/C++ Code Profiling Metrics in Polyspace Platform User Interface
- Automate C/C++ Code Profiling Using Polyspace Platform Projects
- Troubleshoot Code Profiling for Polyspace Test xUnit API-Based Tests
- Improve or Justify Missing Code Coverage Results