Run C/C++ Code Sanitizer and Review Results in Polyspace Platform User Interface
When running C/C++ tests using Polyspace® Test™, you can enable a code sanitizer to detect run-time errors during test execution. The code sanitizer instruments expressions that might cause numerical errors or memory management issues at run-time. If any of these issues actually occur during test execution, they are reported as test failures. In addition, a sanitizer profiling report lists all instrumented expressions and indicates whether a failure was detected for each one.
This topic shows how to run C/C++ tests with a code sanitizer enabled in the user interface.
Example Files
This tutorial uses the files in the folder polyspaceroot\polyspace\examples\doc_pstest\sanitizer_profiling\srcpolyspacerootC:\Program Files\Polyspace\R2026a. To continue with this tutorial:
Create a new Polyspace Platform project and add the folder to the project.
Select Parse Code on the toolstrip to analyze the files in the folder.
The folder contains the following two files:
decls.hpp:struct SF { SF(int v): fld{static_cast<unsigned int>(v)} {} unsigned int fld:6; // representable range [0..63] }; enum { SIZE_2 = 2, SIZE_33 = 33 }; struct Sx3 { double a[SIZE_33][SIZE_2]; } gsX3;example.cpp:This file contains a function#include <string> #include <climits> #include <cmath> #include <vector> #include "decls.hpp" uint32_t compute_left_shift(std::vector<SF>&& v) { std::vector<SF> v0 {std::move(v)}; v0[0].fld <<= v0[1].fld; return v0[0].fld; } void store_floating_values(uint32_t i, double x, double y) { gsX3.a[i][0] = x; gsX3.a[i][1] = y; } float (*funcPtr)(float, float) = nullptr; float compute_pow(float x, float y) { // If x is a finite value less than 0, and y is a finite noninteger, // a domain error occurs, and a NaN is returned. const float r = (*funcPtr)(x, y); // powf(-1.0, -2.4) return r; } int32_t compute_results(int32_t input) { std::vector<SF> v0 = {input, 4}; const uint32_t index = compute_left_shift(std::move(v0)); store_floating_values(index, -1.0F, -2.4F); funcPtr = powf; (void)compute_pow(gsX3.a[index][0], gsX3.a[index][1]); return 0; }compute_results(), which invokes the other three functionscompute_left_shift(),store_floating_values(), andcompute_pow().
Build Project with Code Sanitizer Enabled
Enable code sanitizer profiling before building and running tests in a Polyspace Platform project.
Write the following three tests for the function
compute_results(). To write a test, right-click the function under the Code node of the project and select Add Test Case. Each test is meant to trigger a specific run-time error in one of the functions.In the first test, set the value of
inputto 2 in the Test Inputs section. Remove all other inputs and assessments. Name this testtest_pow.In the second test, set the value of
inputto 3 in the Test Inputs section. Remove all other inputs and assessments. Name this testtest_array_access.In the third test, set the value of
inputto 4 in the Test Inputs section. Remove all other inputs and assessments. Name this testtest_shift.
On the Polyspace Platform toolstrip, instead of No profiling, select Sanitizer.
Build the project and run tests as usual. For more information, see Build and Run Tests in Polyspace Platform User Interface.
After running tests, on the Results pane, you see two nodes:
Tests, containing the results of test execution.
Sanitizer Profiling, containing all expressions identified as potential failure points along with information on whether any of the tests had a run-time error at those points.
View Errors as Test Failures
Each test in this example was written to cause a specific type of run-time error. To see the run-time errors:
Double-click the Tests node on the Results pane.
On the Project Overview dashboard, you see that all three tests failed.
On the toolstrip, select Review. You see the following results:
The Results List pane shows three test failures.
If you select a test failure in the list, the Result Details pane shows the issue that occurred as a failed assessment (similar to any other test failure). The issue name appears in the Message column and further details of the issue appear in the Diagnostic column. Select the row containing the issue to navigate to the line causing the issue in the source code.
For instance, in this example, if you select the test
test_array_access, you see on the Result Details pane that the test has encountered the issue Out of bounds array index (OUT_BOUND_ARRAY). You can select the row containing the issue to navigate to the linegsX3.a[i][0] = x;. For more information on the issue acronyms, see Issues Detected Using Polyspace Test Code Sanitizer.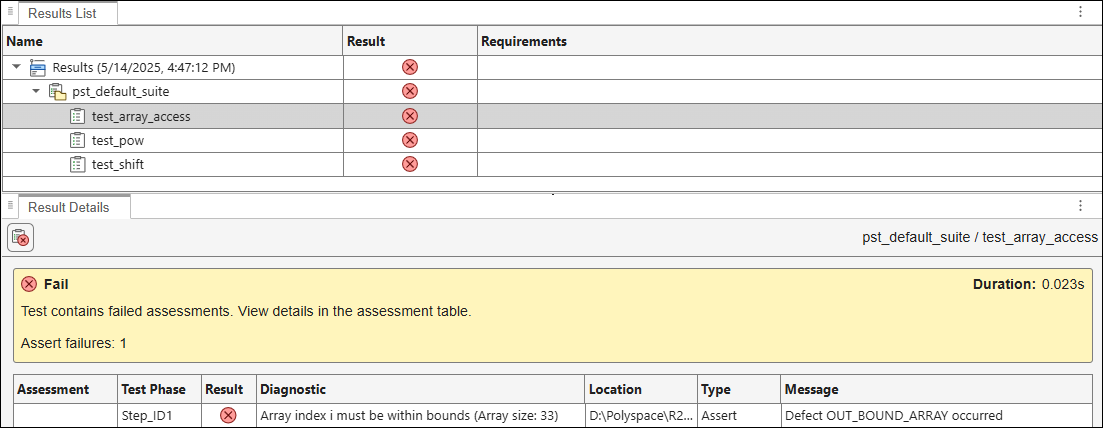
To investigate further, run tests with debugging enabled and by placing breakpoints at the lines identified in the previous step, see the values of variables that cause the issue. For more information on debugging, see Debug Test Failures from Polyspace Platform User Interface.
View Errors as Sanitizer Profiling Results
Instead of viewing the errors as test failures, you can also see them in a sanitizer profiling report. Unlike test results, which show the errors test by test, the sanitizer profiling report shows a list of expressions that were identified as potential failure points. For each expression, the report shows possible errors that the expression can cause. For each error, you see how many tests ran into the error with one example.
To see the sanitizer profiling report:
Double-click the Sanitizer Profiling node on the Results pane.
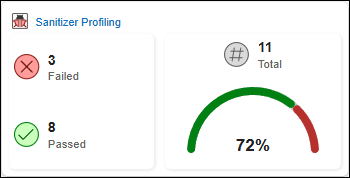
On the Project Overview dashboard, you see in the Sanitizer Profiling section that three expressions caused errors during test execution.
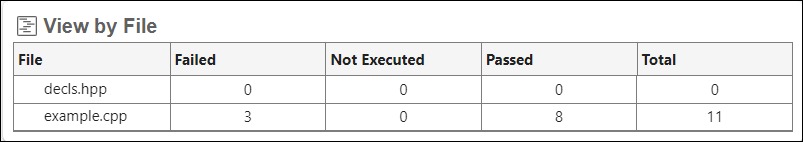
You can also select Sanitizer Profiling on the toolstrip to see a file-by-file breakdown of the sanitizer profiling results.
On the toolstrip, select Review. Since sanitizer profiling results are not supported for review in the user interface, you get the option to view details of the results in an HTML report. Confirm generation of the HTML report.
The HTML report opens in a web browser. Continue reviewing the sanitizer profiling results in this report. For more information, see Structure of HTML Reports Generated from C/C++ Code Sanitizer Results.