超链接图像
此示例显示如何将图像中的区域定义为超链接。您可以定义超链接,以便它们链接到目标网页或导航到同一报告中的另一个位置。
导入 DOM 和报告 API 包,这样您就不必使用长而完全限定的类名。
import mlreportgen.dom.*
import mlreportgen.report.*
创建并打开报告。
% To create an HTML report, change "pdf” to “html” or "html-file" for a
% multifile or single-file report, respectively.
rpt = Report("myreport","pdf");
open(rpt);
在报告中添加一个段落。
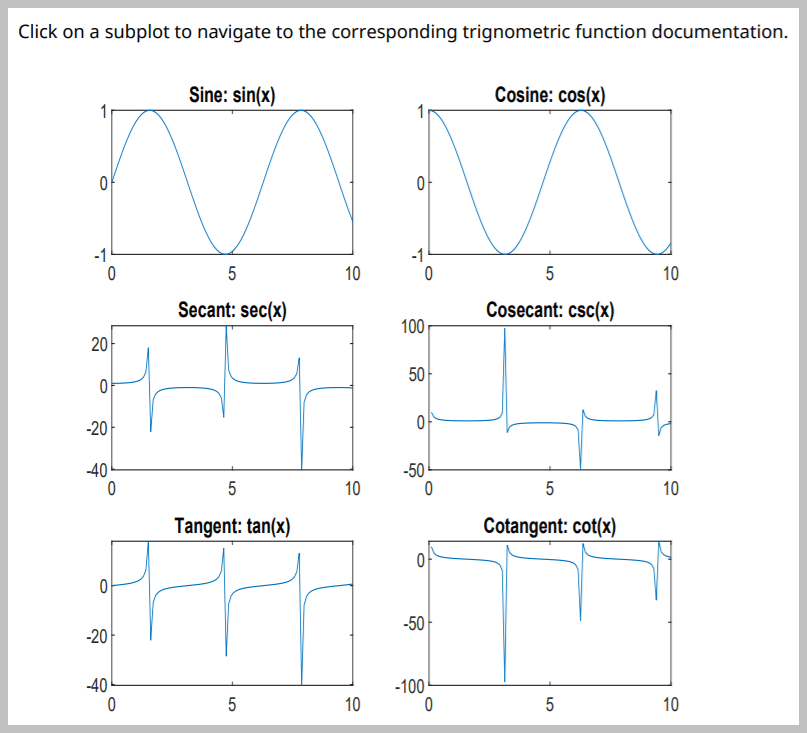
content = "Click on a subplot to navigate to the corresponding " + ...
    "trigonometric function documentation.";
add(rpt,Paragraph(content));
创建一个包含不同三角函数的多个子图的图窗。
figH = figure;
x = linspace(0,10);

sinePlot = subplot(3,2,1,"Units","pixels");
plot(x,sin(x));
title("Sine: sin(x)");

cosinePlot = subplot(3,2,2,"Units","pixels");
plot(x,cos(x));
title("Cosine: cos(x)");

secantPlot = subplot(3,2,3,"Units","pixels");
plot(x,sec(x));
title("Secant: sec(x)");

cosecantPlot = subplot(3,2,4,"Units","pixels");
plot(x,csc(x));
title("Cosecant: csc(x)");

tangentPlot = subplot(3,2,5,"Units","pixels");
plot(x,tan(x));
title("Tangent: tan(x)");

cotangentPlot = subplot(3,2,6,"Units","pixels");
plot(x,cot(x));
title("Cotangent: cot(x)");
使用 Figure 报告器获取图窗快照。使用 DOM Image 将快照包含在报告中。
figReporter = Figure("Source",figH,"SnapshotFormat","jpg");
imgPath = getSnapshotImage(figReporter,rpt);

figImg = Image(imgPath);
在快照上创建一个图像映射,其中每个子图都有一个图像区域。本示例末尾定义的 getCoords 函数获取每个子图的坐标。子图图像区域的目标被设置为用于创建该子图的三角函数的文档网页。然后,将快照添加到报告中。
map = ImageMap;

sinePlotCoords = getCoords(sinePlot);
sinePlotArea = ImageArea("https://www.mathworks.com/help/matlab/ref/sin.html", ...
    "Sine",sinePlotCoords);
append(map,sinePlotArea);

cosinePlotCoords = getCoords(cosinePlot);
cosinePlotArea = ImageArea("https://www.mathworks.com/help/matlab/ref/cos.html", ...
    "Cosine",cosinePlotCoords);
append(map,cosinePlotArea);

secantPlotCoords = getCoords(secantPlot);
secantPlotArea = ImageArea("https://www.mathworks.com/help/matlab/ref/sec.html", ...
    "Secant",secantPlotCoords);
append(map,secantPlotArea);

cosecantPlotCoords = getCoords(cosecantPlot);
cosecantPlotArea = ImageArea("https://www.mathworks.com/help/matlab/ref/csc.html", ...
    "Cosecant",cosecantPlotCoords);
append(map,cosecantPlotArea);

tangentPlotCoords = getCoords(tangentPlot);
tangentPlotArea = ImageArea("https://www.mathworks.com/help/matlab/ref/tan.html", ...
    "Tangent",tangentPlotCoords);
append(map,tangentPlotArea);

cotangentPlotCoords = getCoords(cotangentPlot);
cotangentPlotArea = ImageArea("https://www.mathworks.com/help/matlab/ref/cot.html", ...
    "Cotangent",cotangentPlotCoords);
append(map,cotangentPlotArea);

figImg.Map = map;
add(rpt,figImg);
删除图窗窗口。关闭并查看报告。
close(rpt);
delete(figH);
rptview(rpt);
以下函数计算并返回父图中指定子图的左上角和右下角坐标。这些坐标是通过将基于图窗坐标系的子图坐标区坐标(其参考点是左下角)转换为 DOM ImageArea 坐标系(其参考点是图像的左上角)来计算的。
function coords = getCoords(subplot)
    subplotWidth = subplot.Position(3);
    subplotHeight = subplot.Position(4);

    fig = subplot.Parent;
    figHeight = fig.Position(4);

    x1 = subplot.Position(1);
    y1 = figHeight - (subplot.Position(2) + subplotHeight);

    x2 = x1 + subplotWidth;
    y2 = y1 + subplotHeight;

    coords = [x1, y1, x2, y2];
end